Platform Monitoring
Platform Monitoring
Platform monitoring is responsible for ensuring the quality of the platform by providing visibility on the health of the platform and workloads running on it. It allows both platform operators and application teams answer two basic questions: what’s broken and why?
By collecting metrics from key platform components such as control plane, data plane, bastion and tenants workloads, platform monitoring allows operators and application teams to:
- analyse long-term trends (e.g. how quickly is my database growing)
- compare impact of feature releases
- notify when something is broken or might break soon
- help answer basic questions about the health of the system using dashboards
Platform Uptime
Uptime is measured by traffic sent continuously to an application deployed as part of the platform.
To view uptime for each environment you can use Continuous Load Grafana dashboard. For quick access it, run:
corectl env open <env> grafana/continuous-loadApplication resource monitoring
This dashboard allows a tenant to monitor their namespaces. It shows:
- CPU Usage
- Memory usage
- Pod status
- Pod restart count
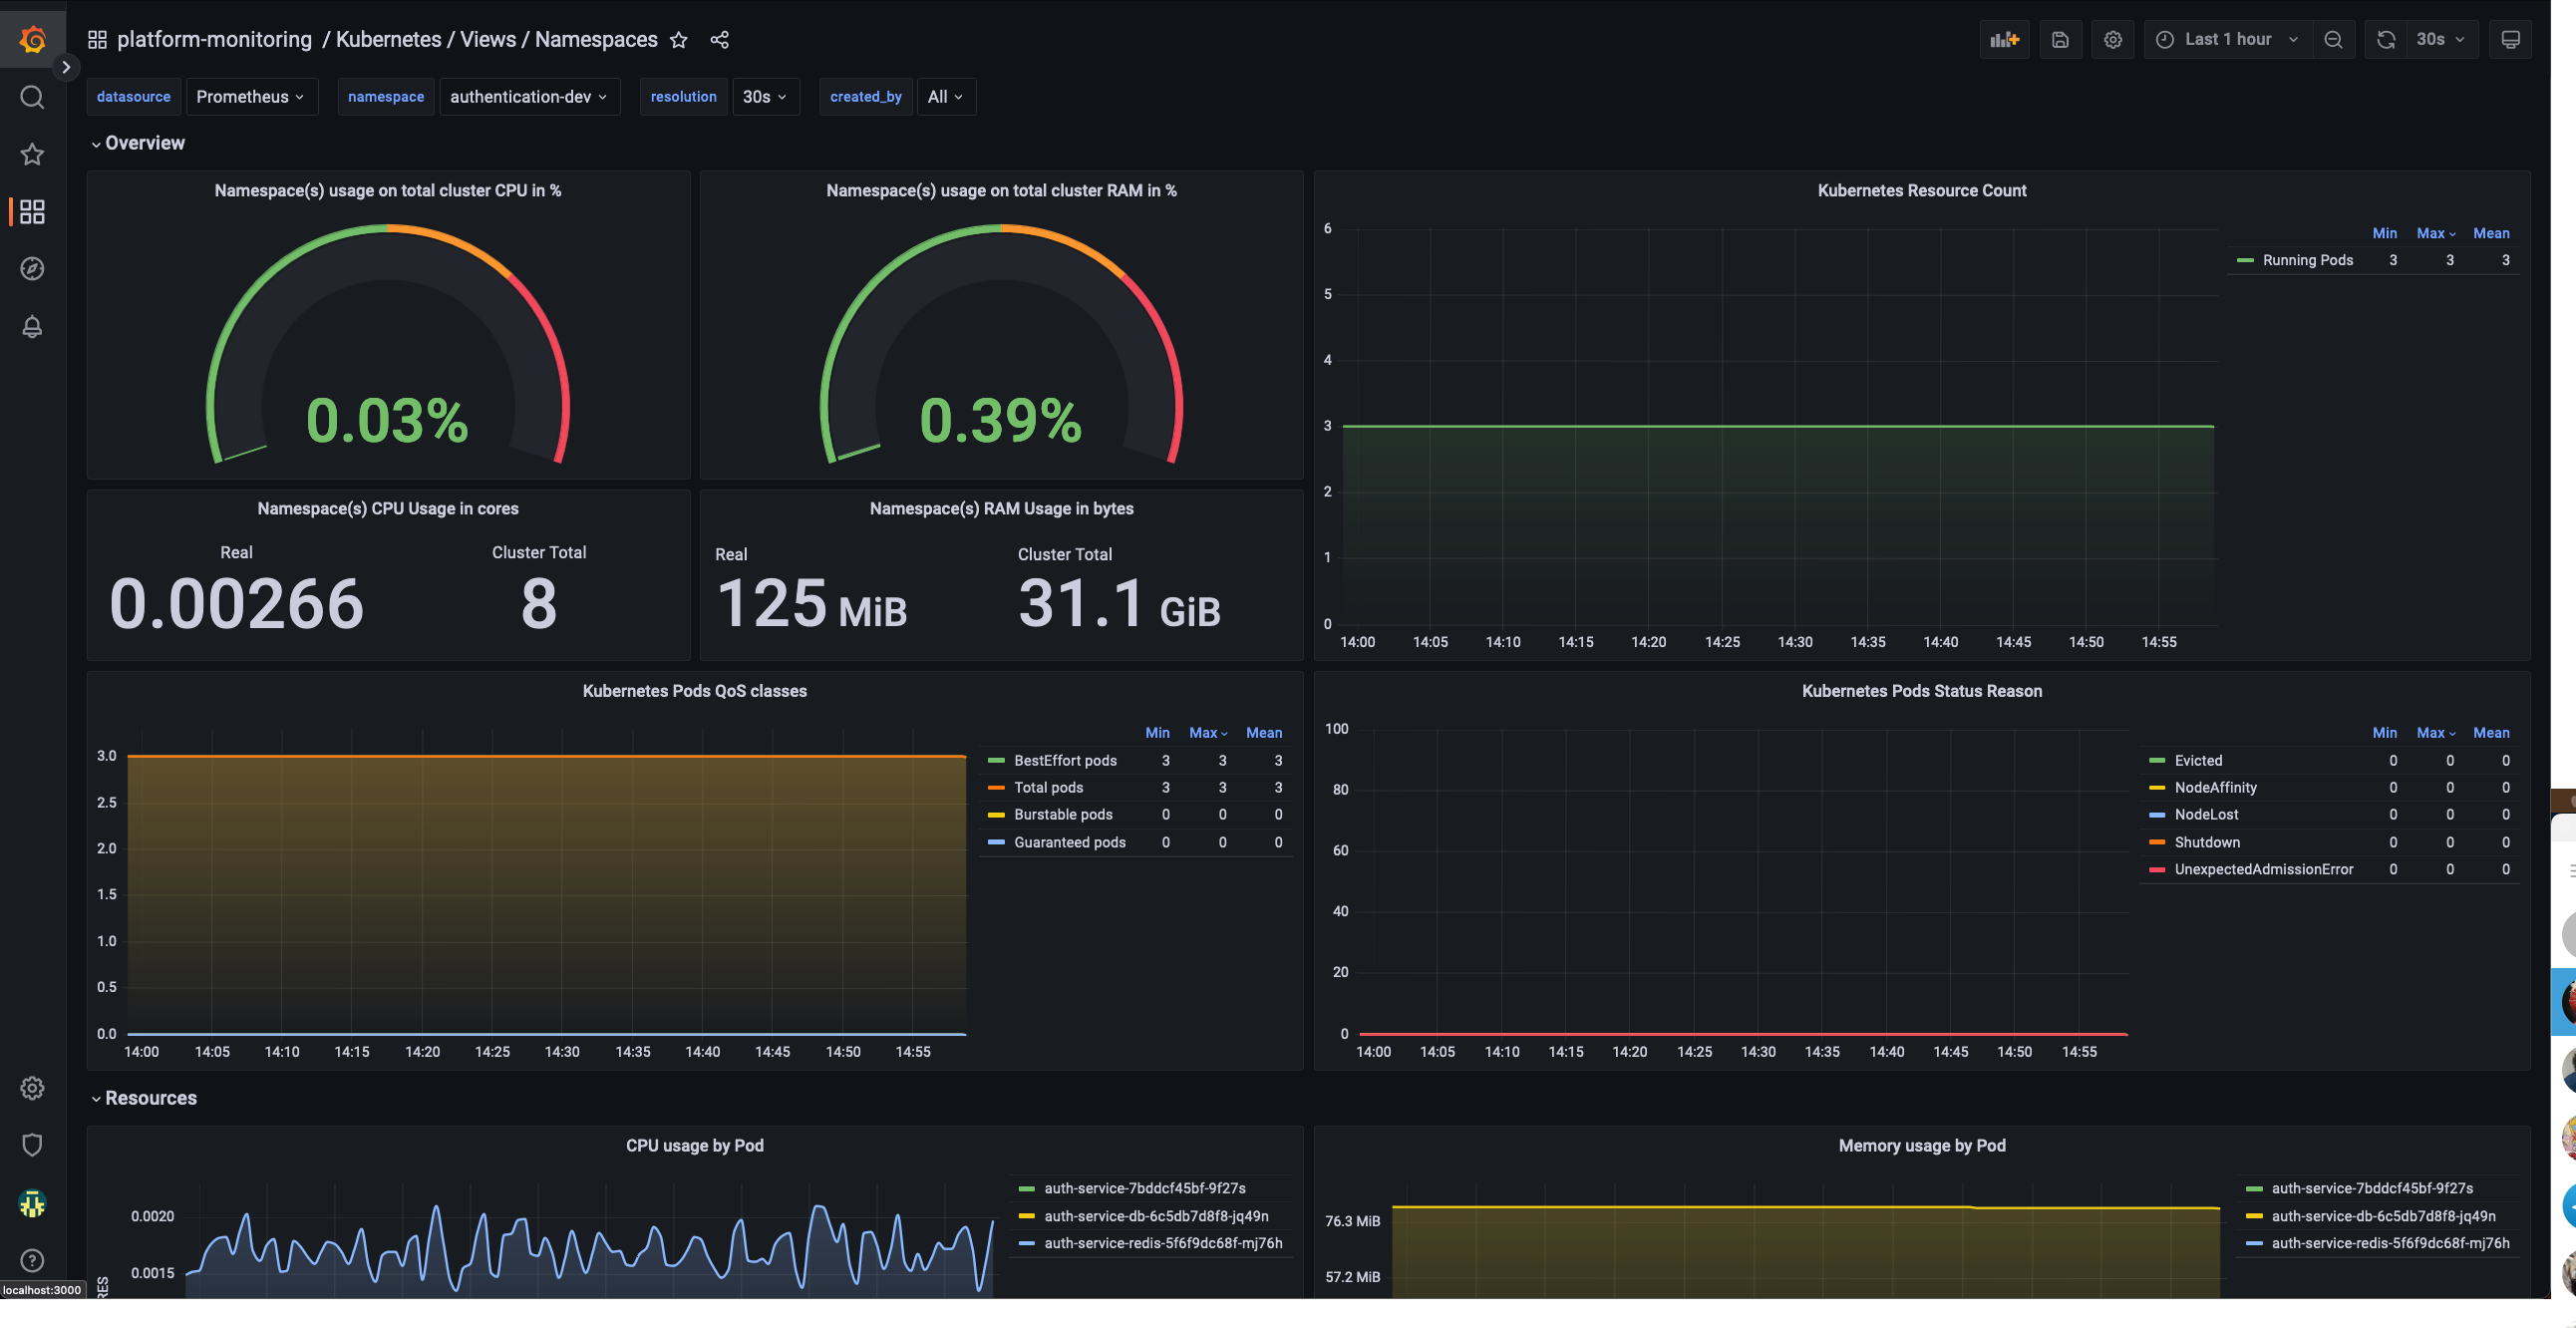
Namespace Dashboard
Cluster wide resource monitoring
Global view dashboard gives holistic view of the cluster. It shows:
- Nodes status
- CPU and Memory usage, requests and limits
- Pod and namespace count
- Pods status
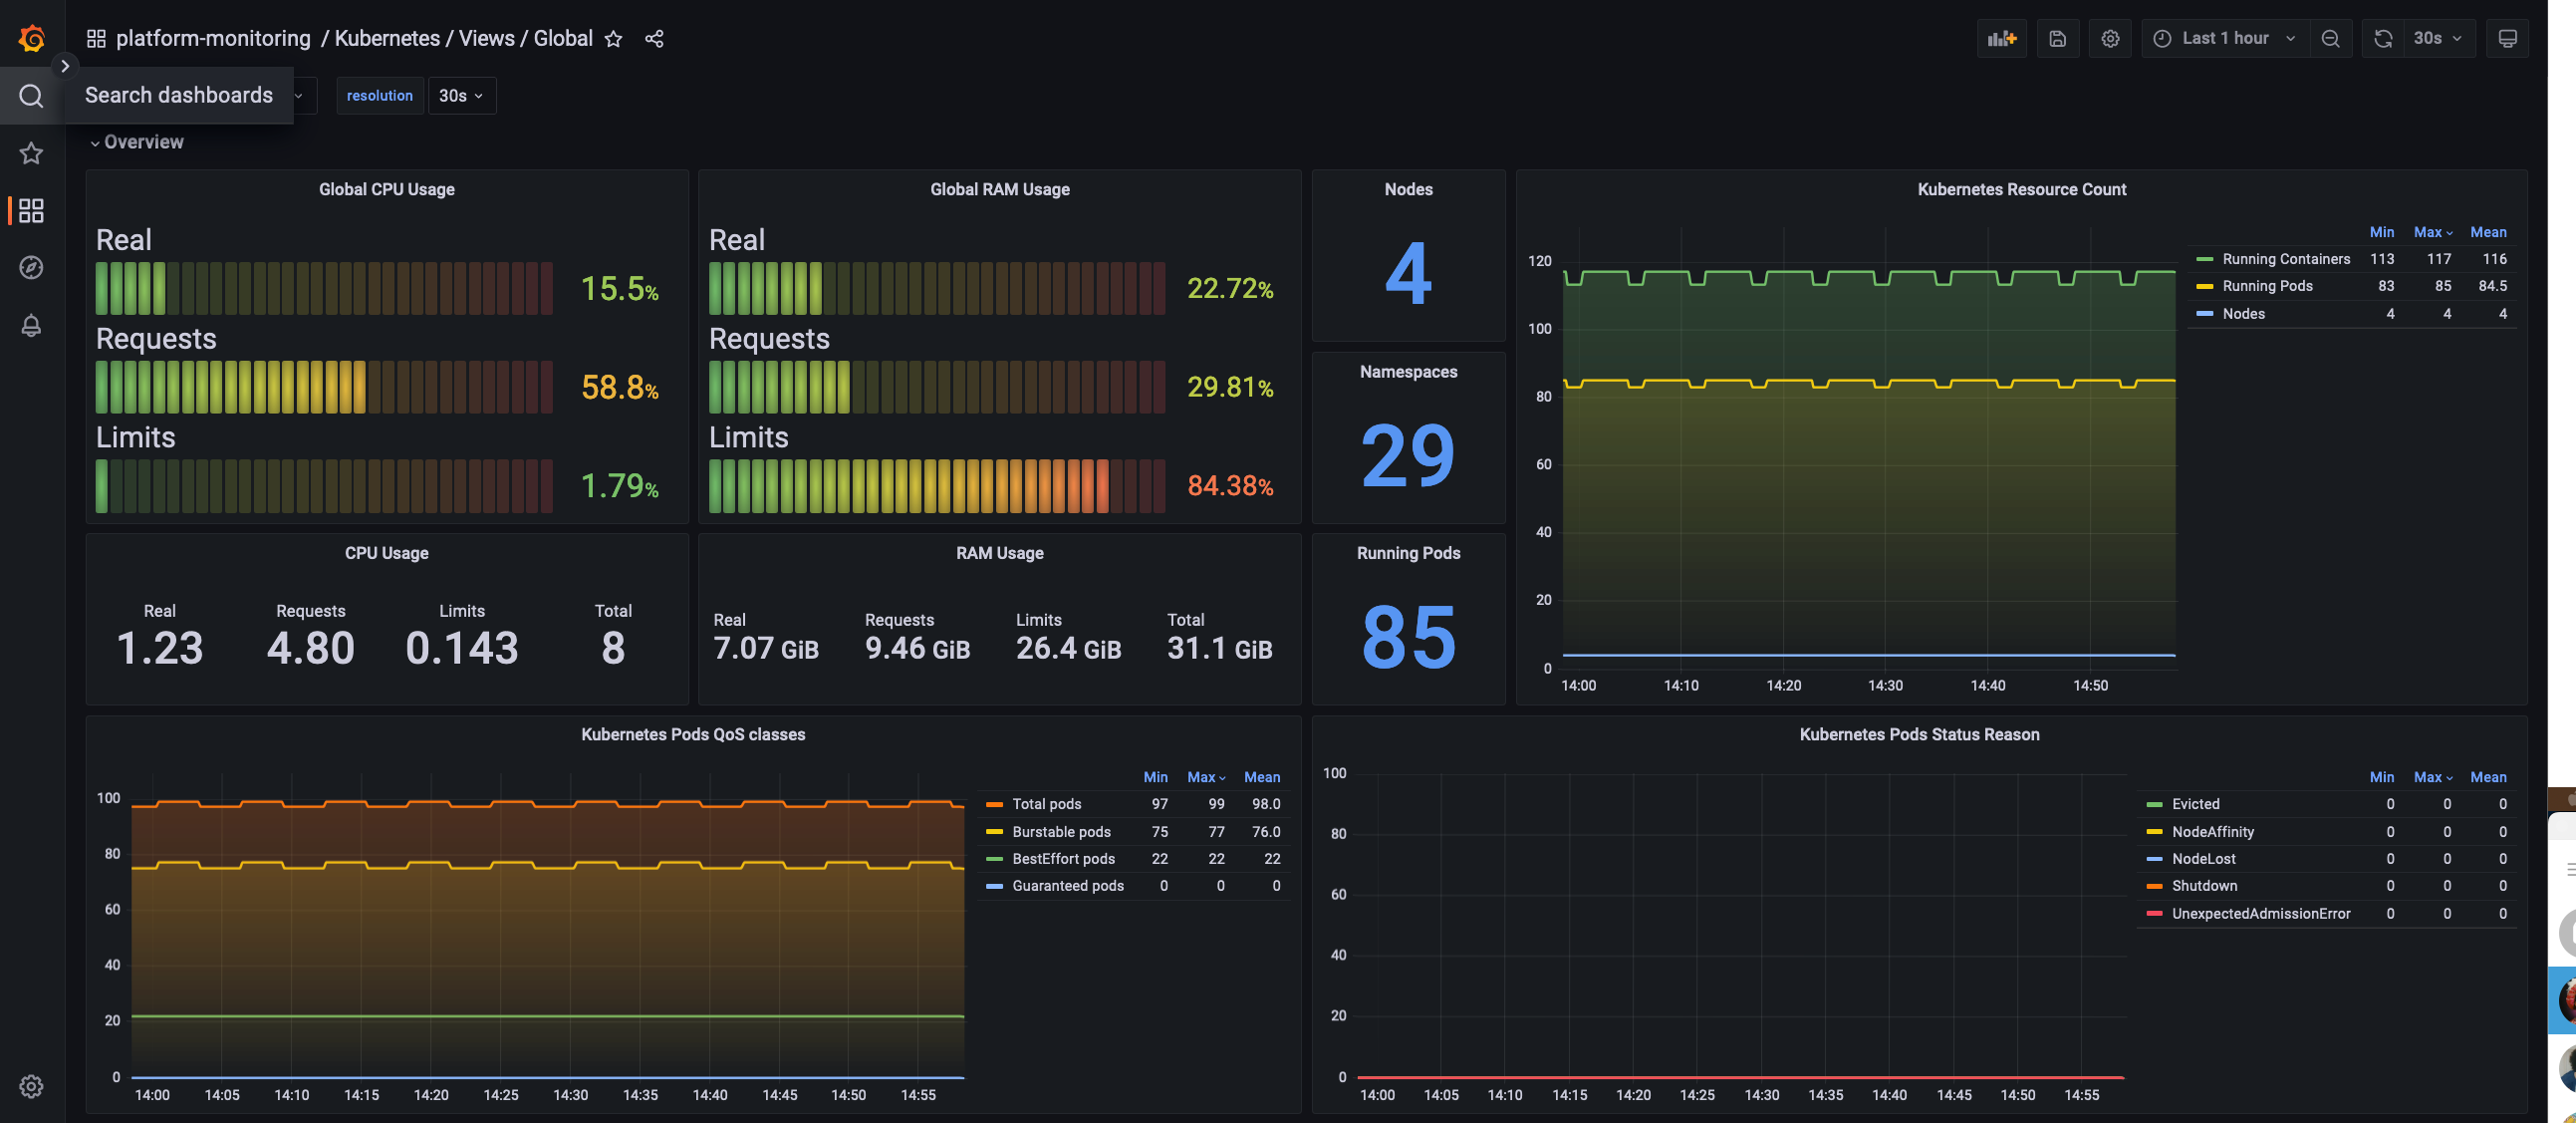
Global Dashboard
Cluster connectivity monitoring
The platform-monitoring module also deploys continuous load.
This will create k6 injectors and pods with podinfo, always with a stable throughput allowing us to monitor with enough data the different percentiles and any errors that occur to ensure that we can be proactive in investigating and fixing any issues.
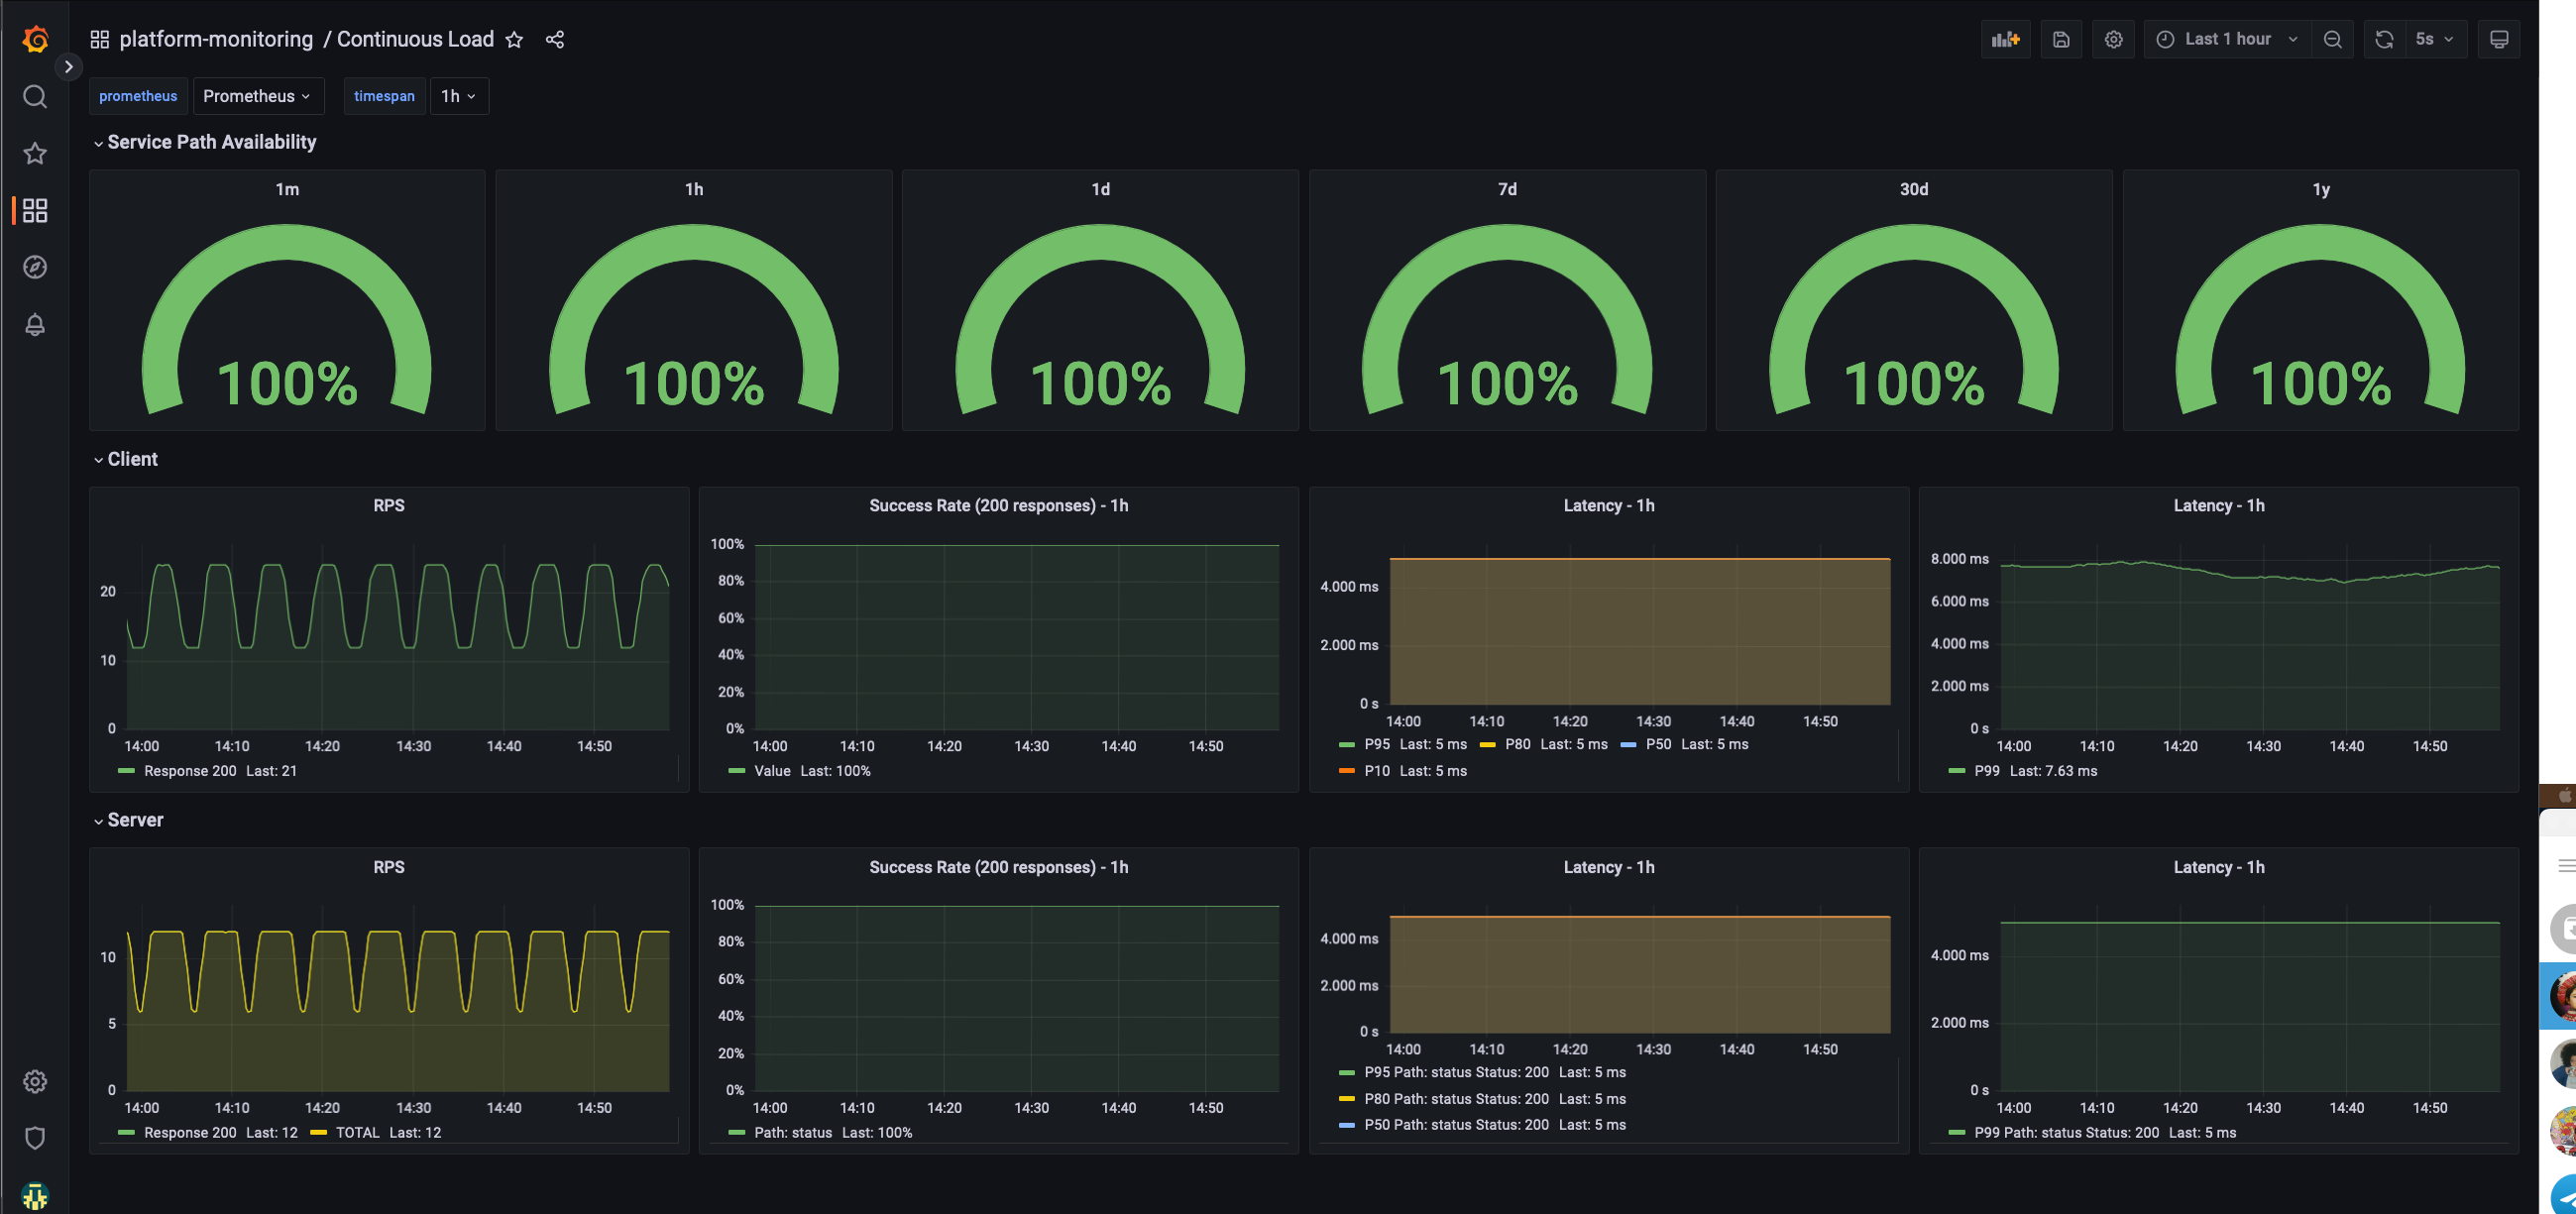
Continuous load Dashboard
Platform liveness
Shows uptime and probe success rate and duration of key endpoints we monitor on the platform. It can also be used to check SSL expiry.
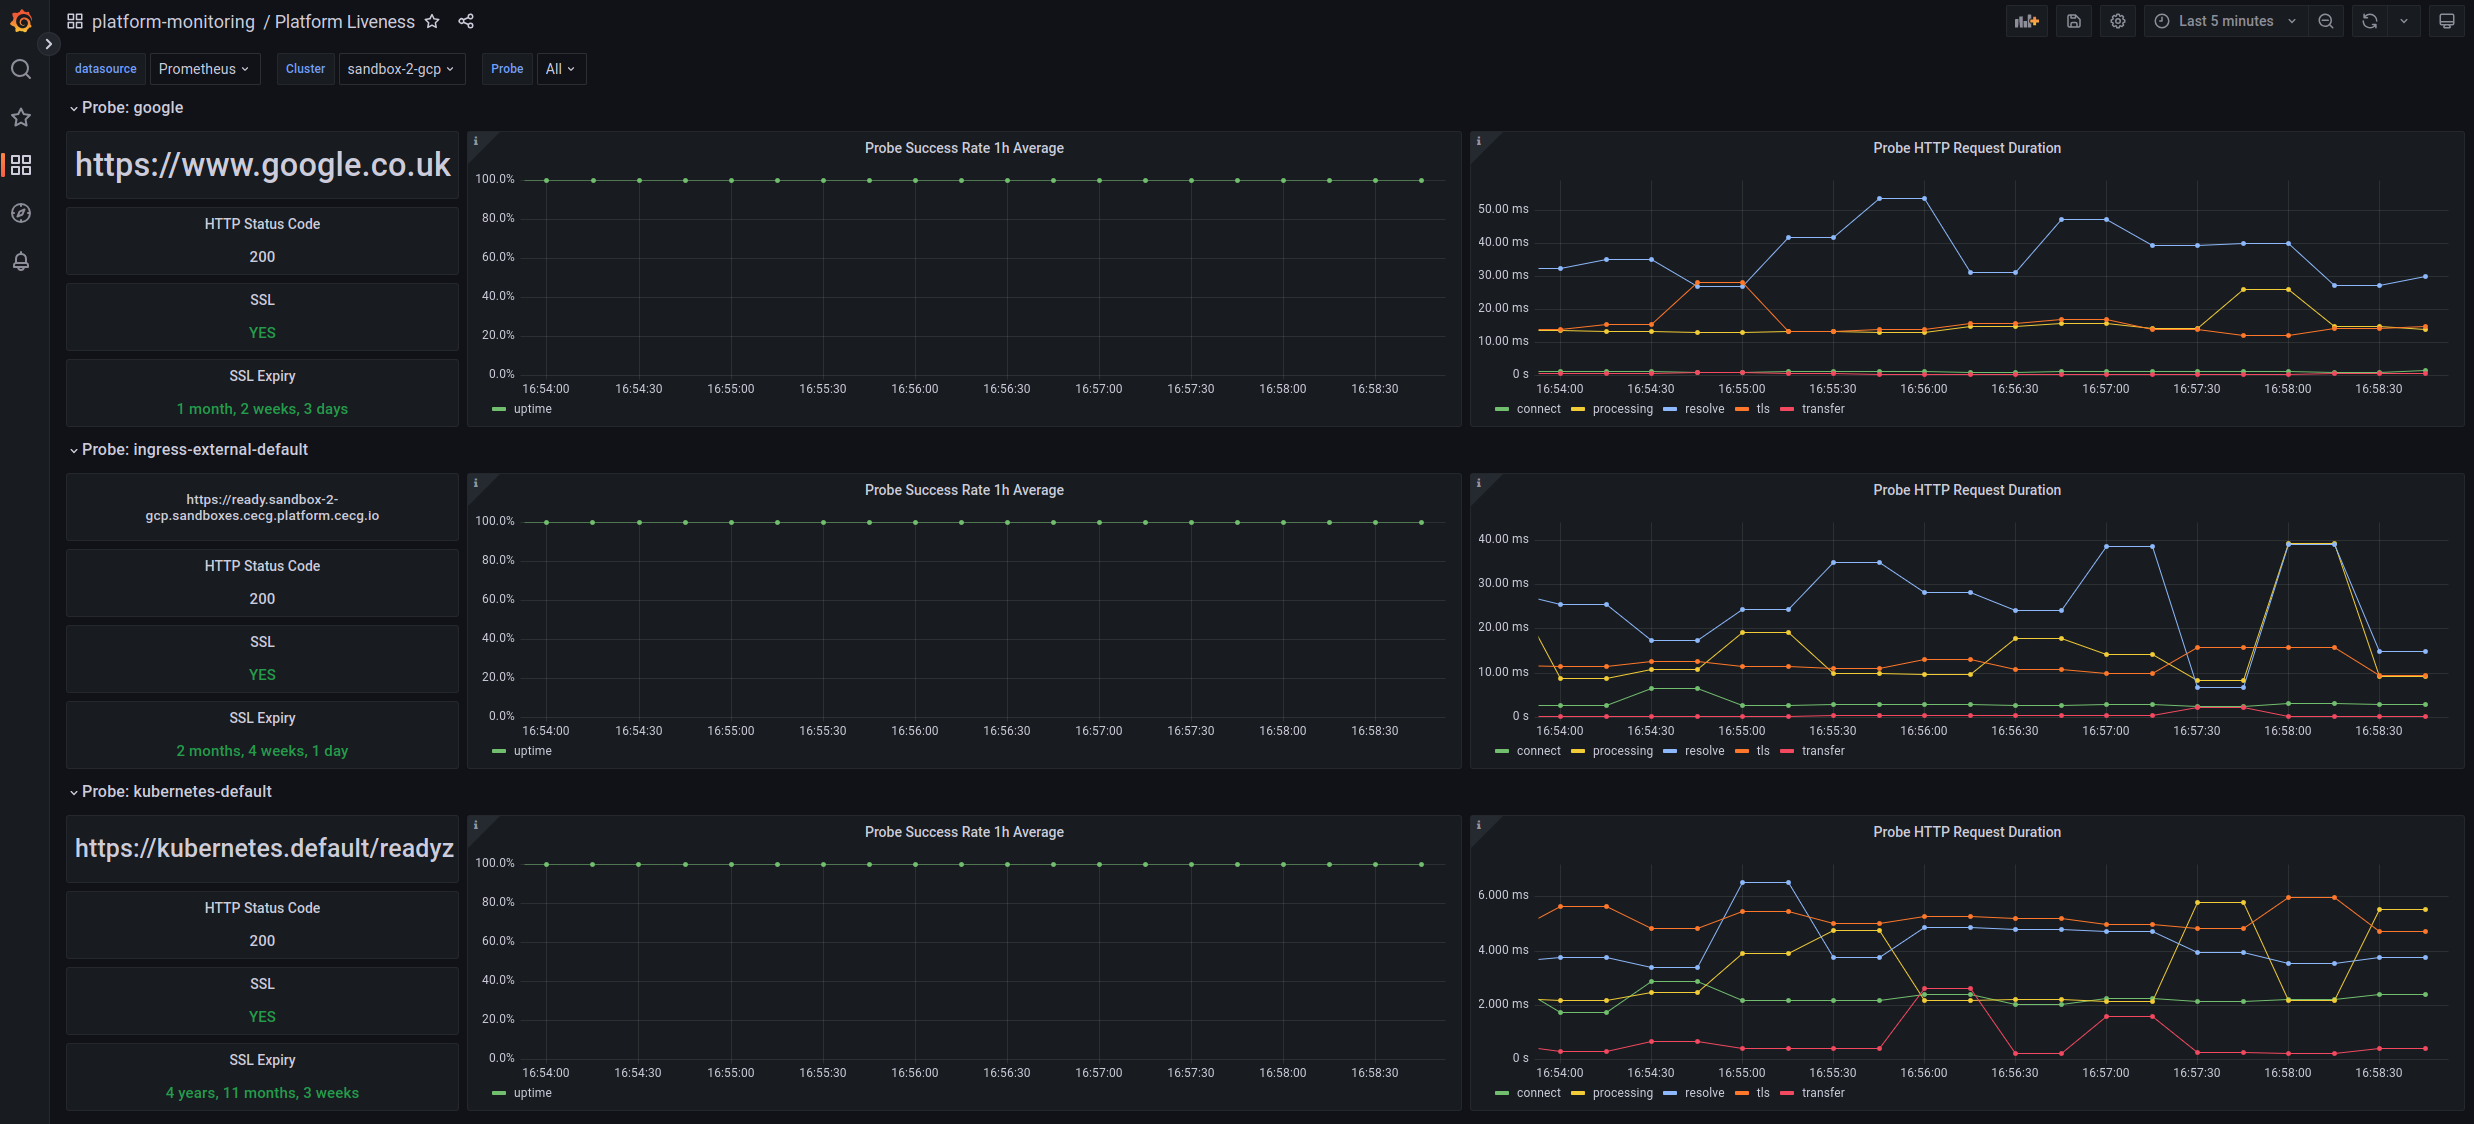
Platform liveness
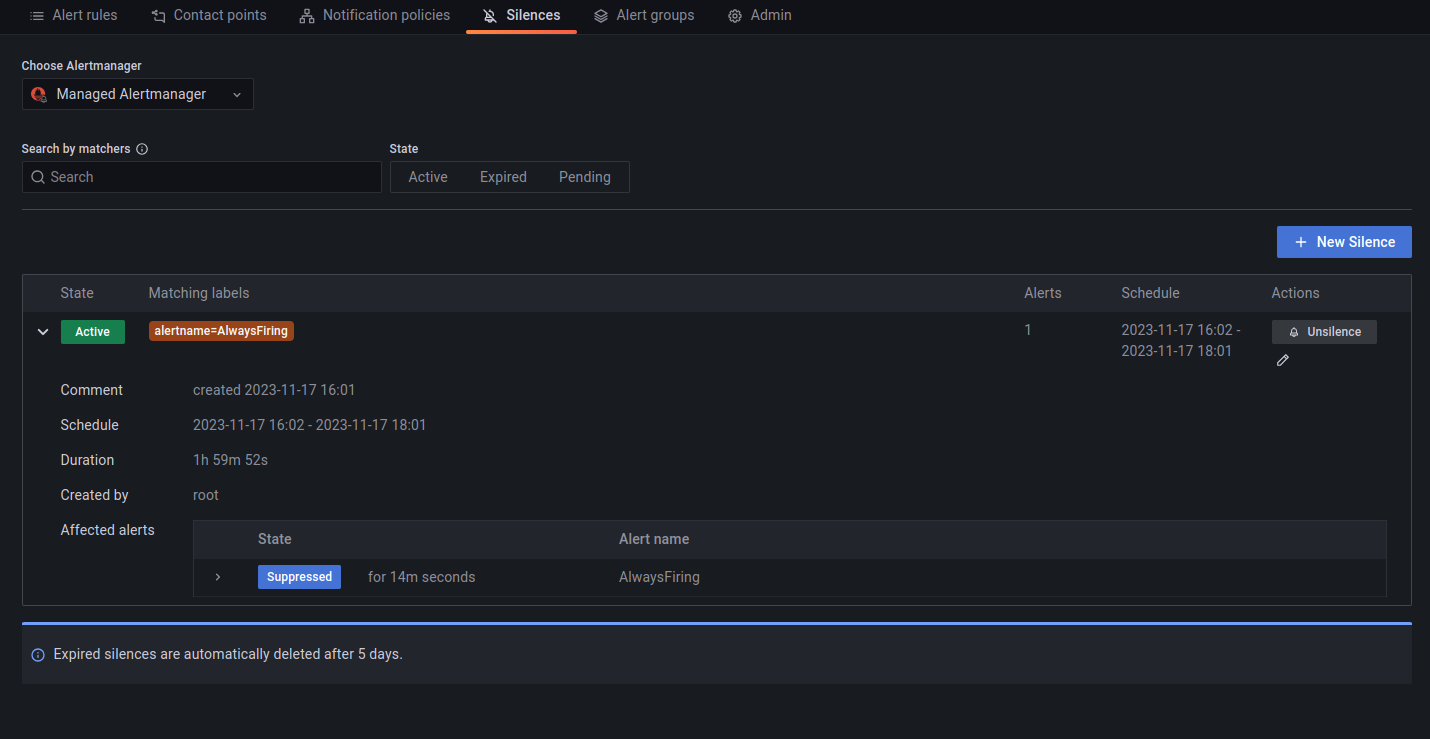
Platform alerts
Firing and silenced alerts
Firing alerts can be viewed in the Grafana UI either via the Alerts dashboard or via the built-in Alerting section. Alerts can be silenced via the Alerting section by matching the alert(s) label that needs silencing.