Application Monitoring
Accessing Grafana
Via internal services
Grafana is available at grafana.internal_services.domain
The internal_services.domain is in the config.yaml for the environment you
want to access grafana for in your Environments Repo.
You can quickly access it by running:
corectl env open <env> grafanaHow can I monitor application resources?
This dashboard will allow a team to monitor their application namespaces and check their status. It will show data like:
- CPU Usage
- Memory usage
- Pod status
- Pod restart count
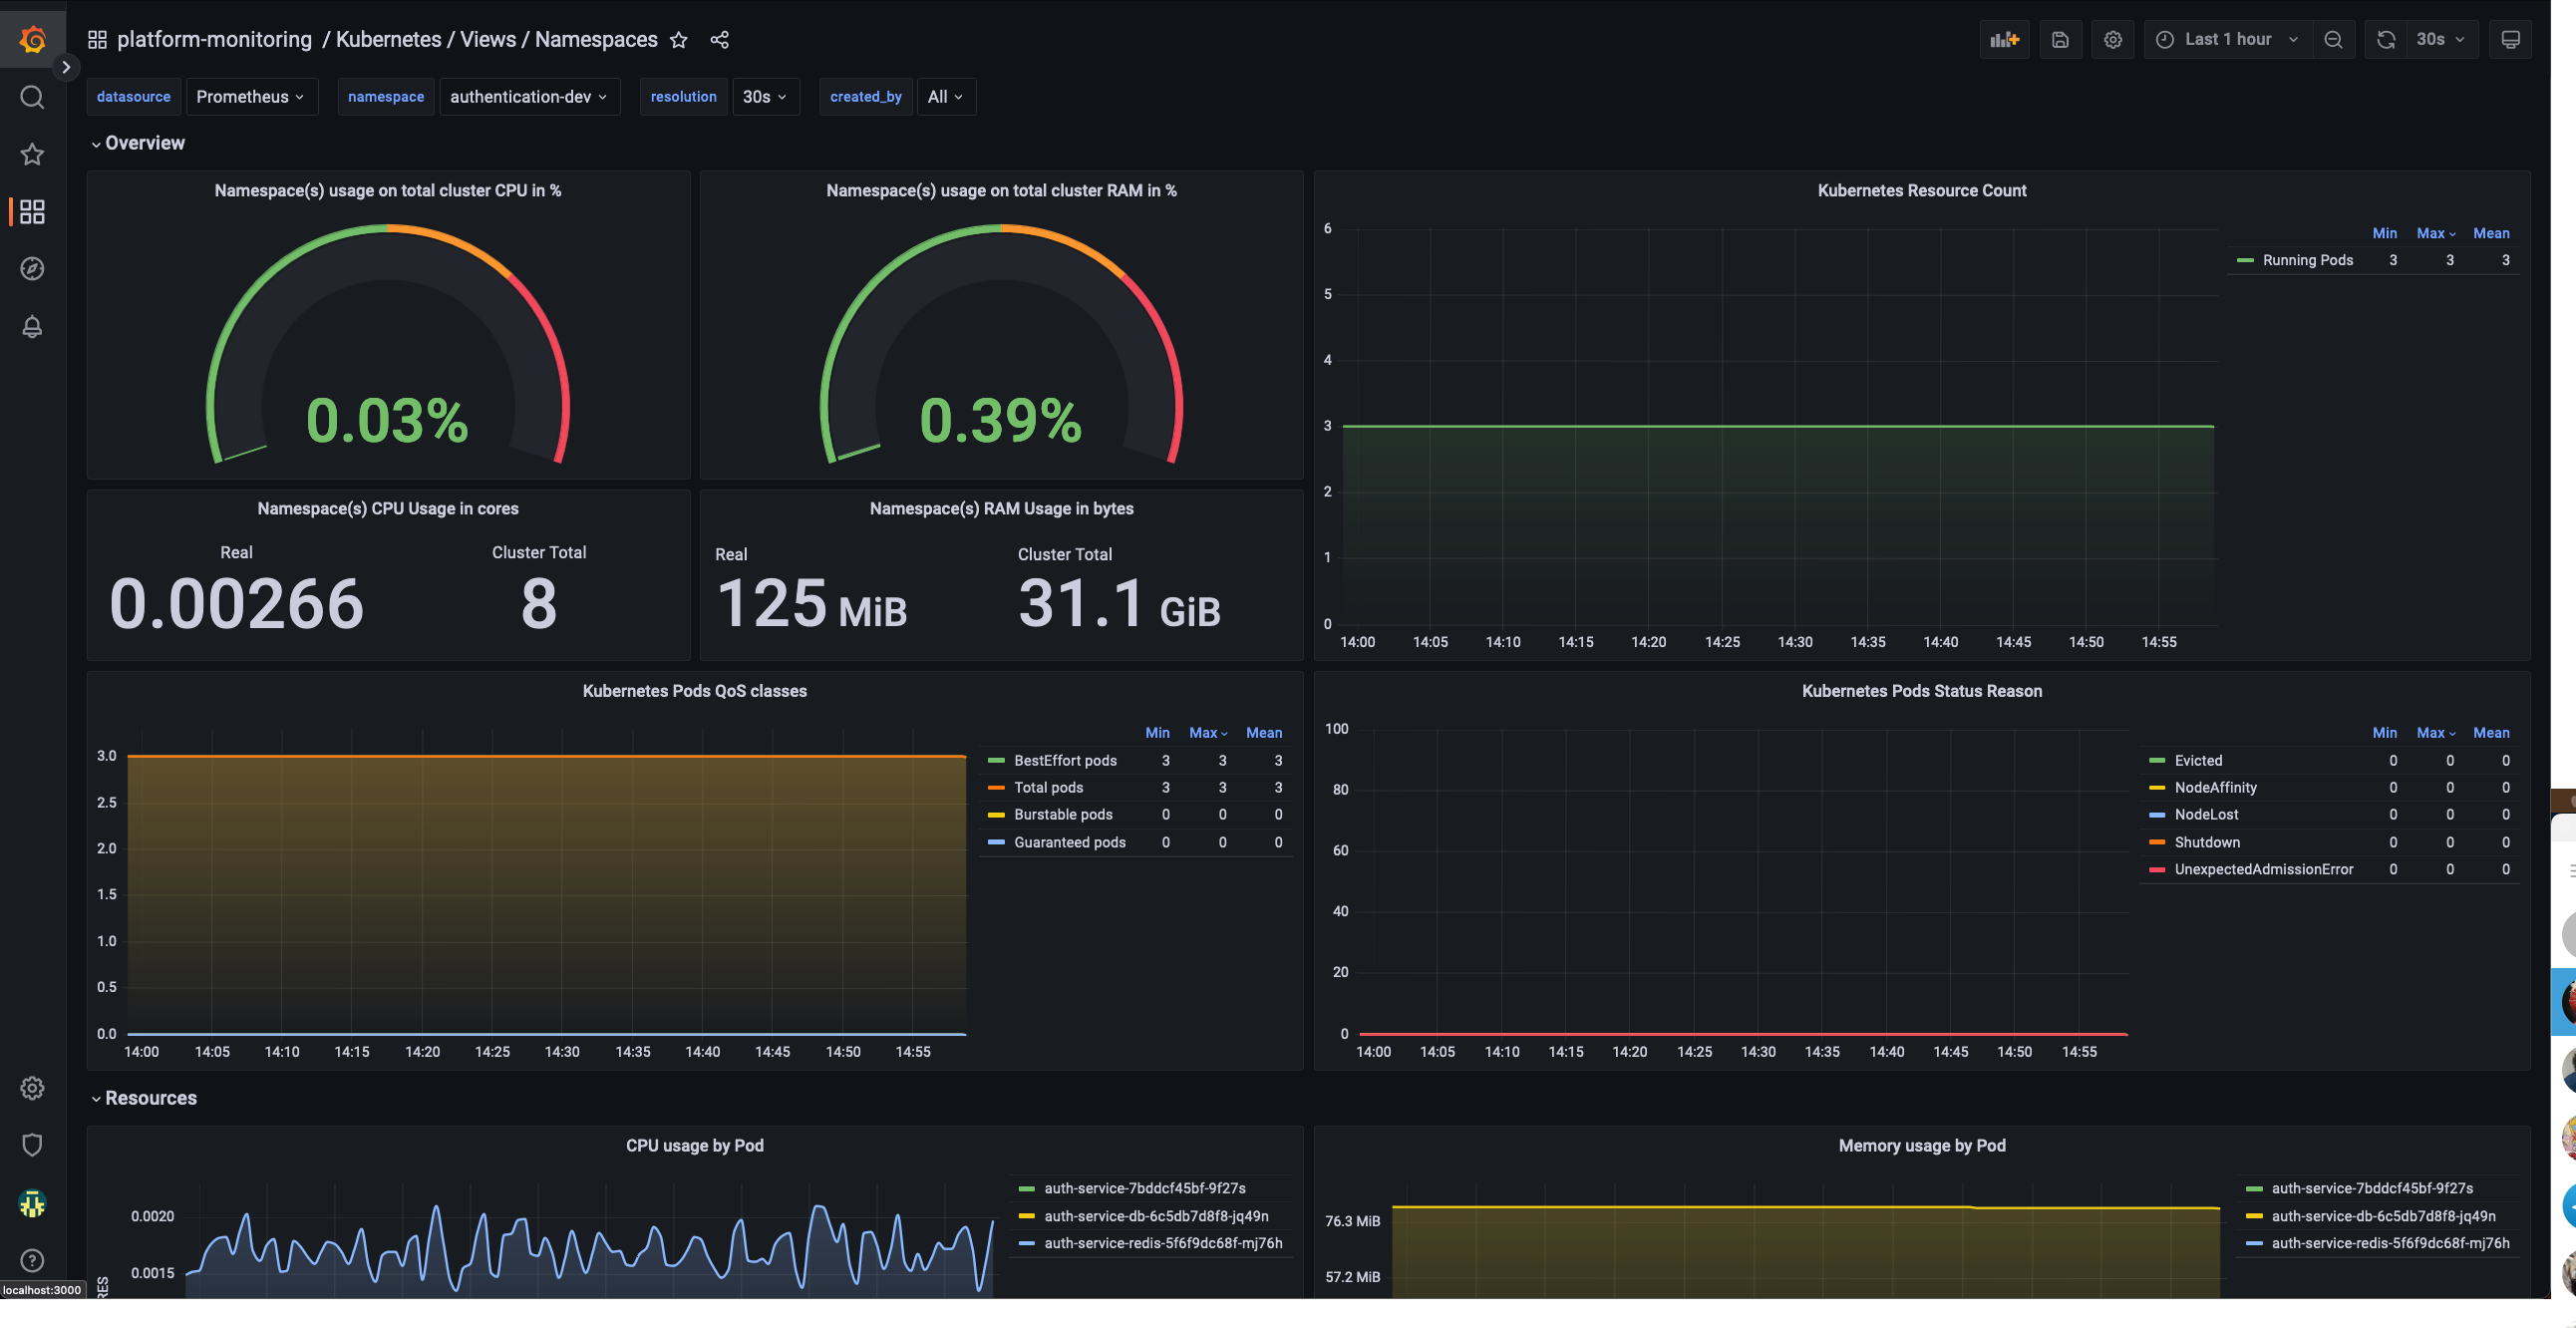
Namespace Dashboard
How can I monitor the whole cluster?
The global view dashboard will give you visibility over the cluster as a whole. This will show you data like:
- Nodes status
- CPU and Memory usage
- CPU and Memory Limits
- CPU and Memory Reserved
- Pod and namespace count
- Pods status
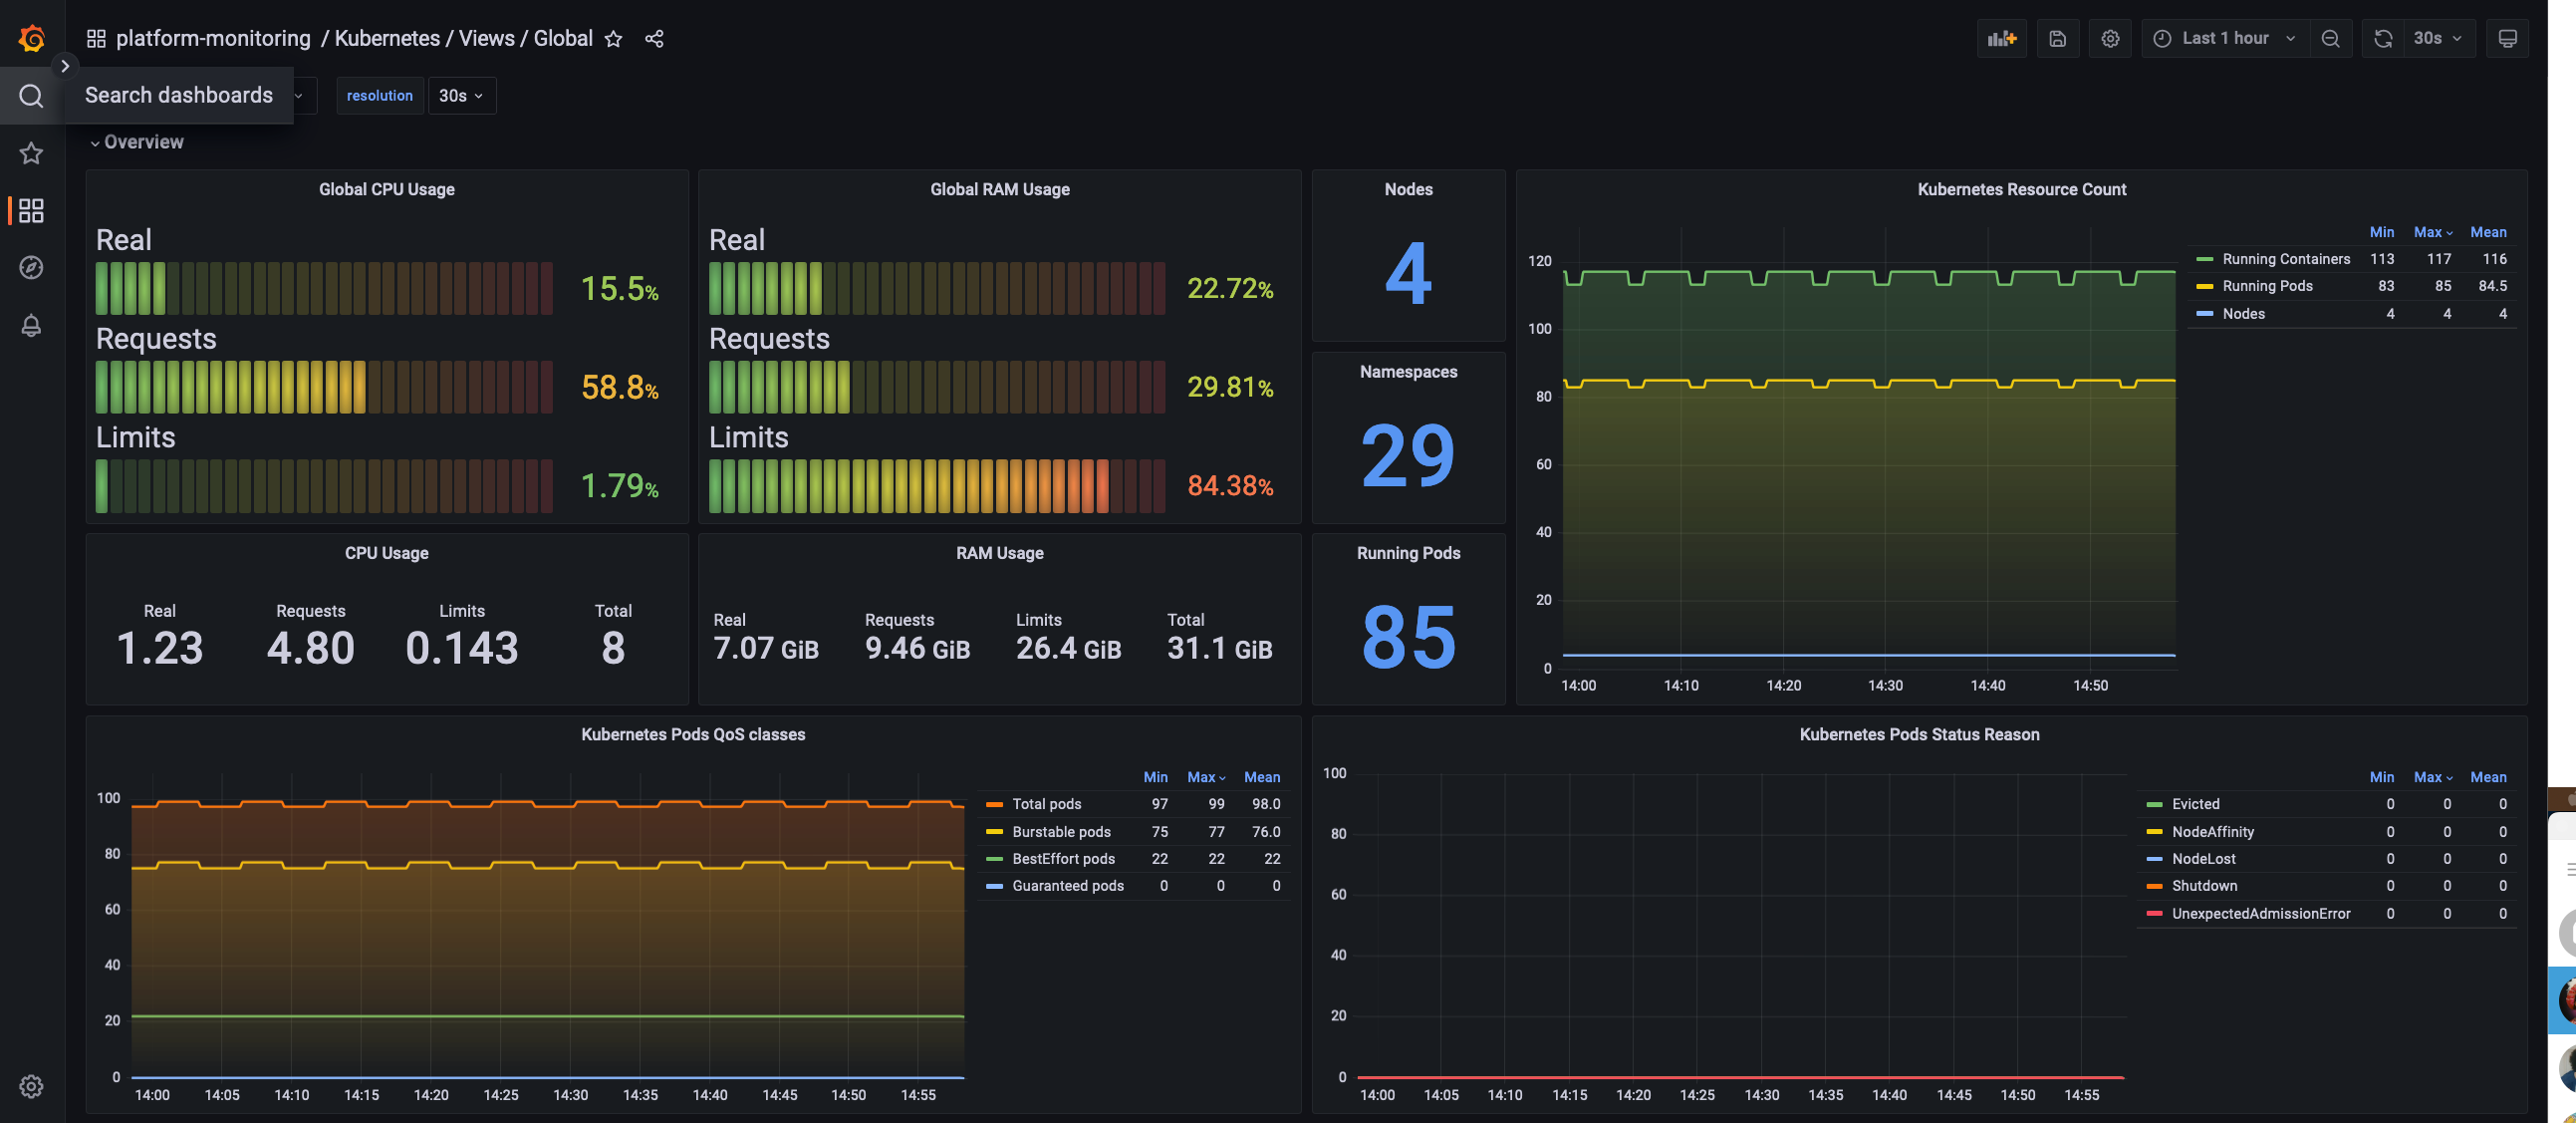
Global Dashboard
How can do I know if the environment is stable?
The platform-monitoring module also deploys a continuous load.
This will create k6 injectors and pods with podinfo, always with a stable throughput allowing us to monitor with
enough data the different percentils and any errors that occur to ensure that we can be proactive in investigating and
fixing any issues.
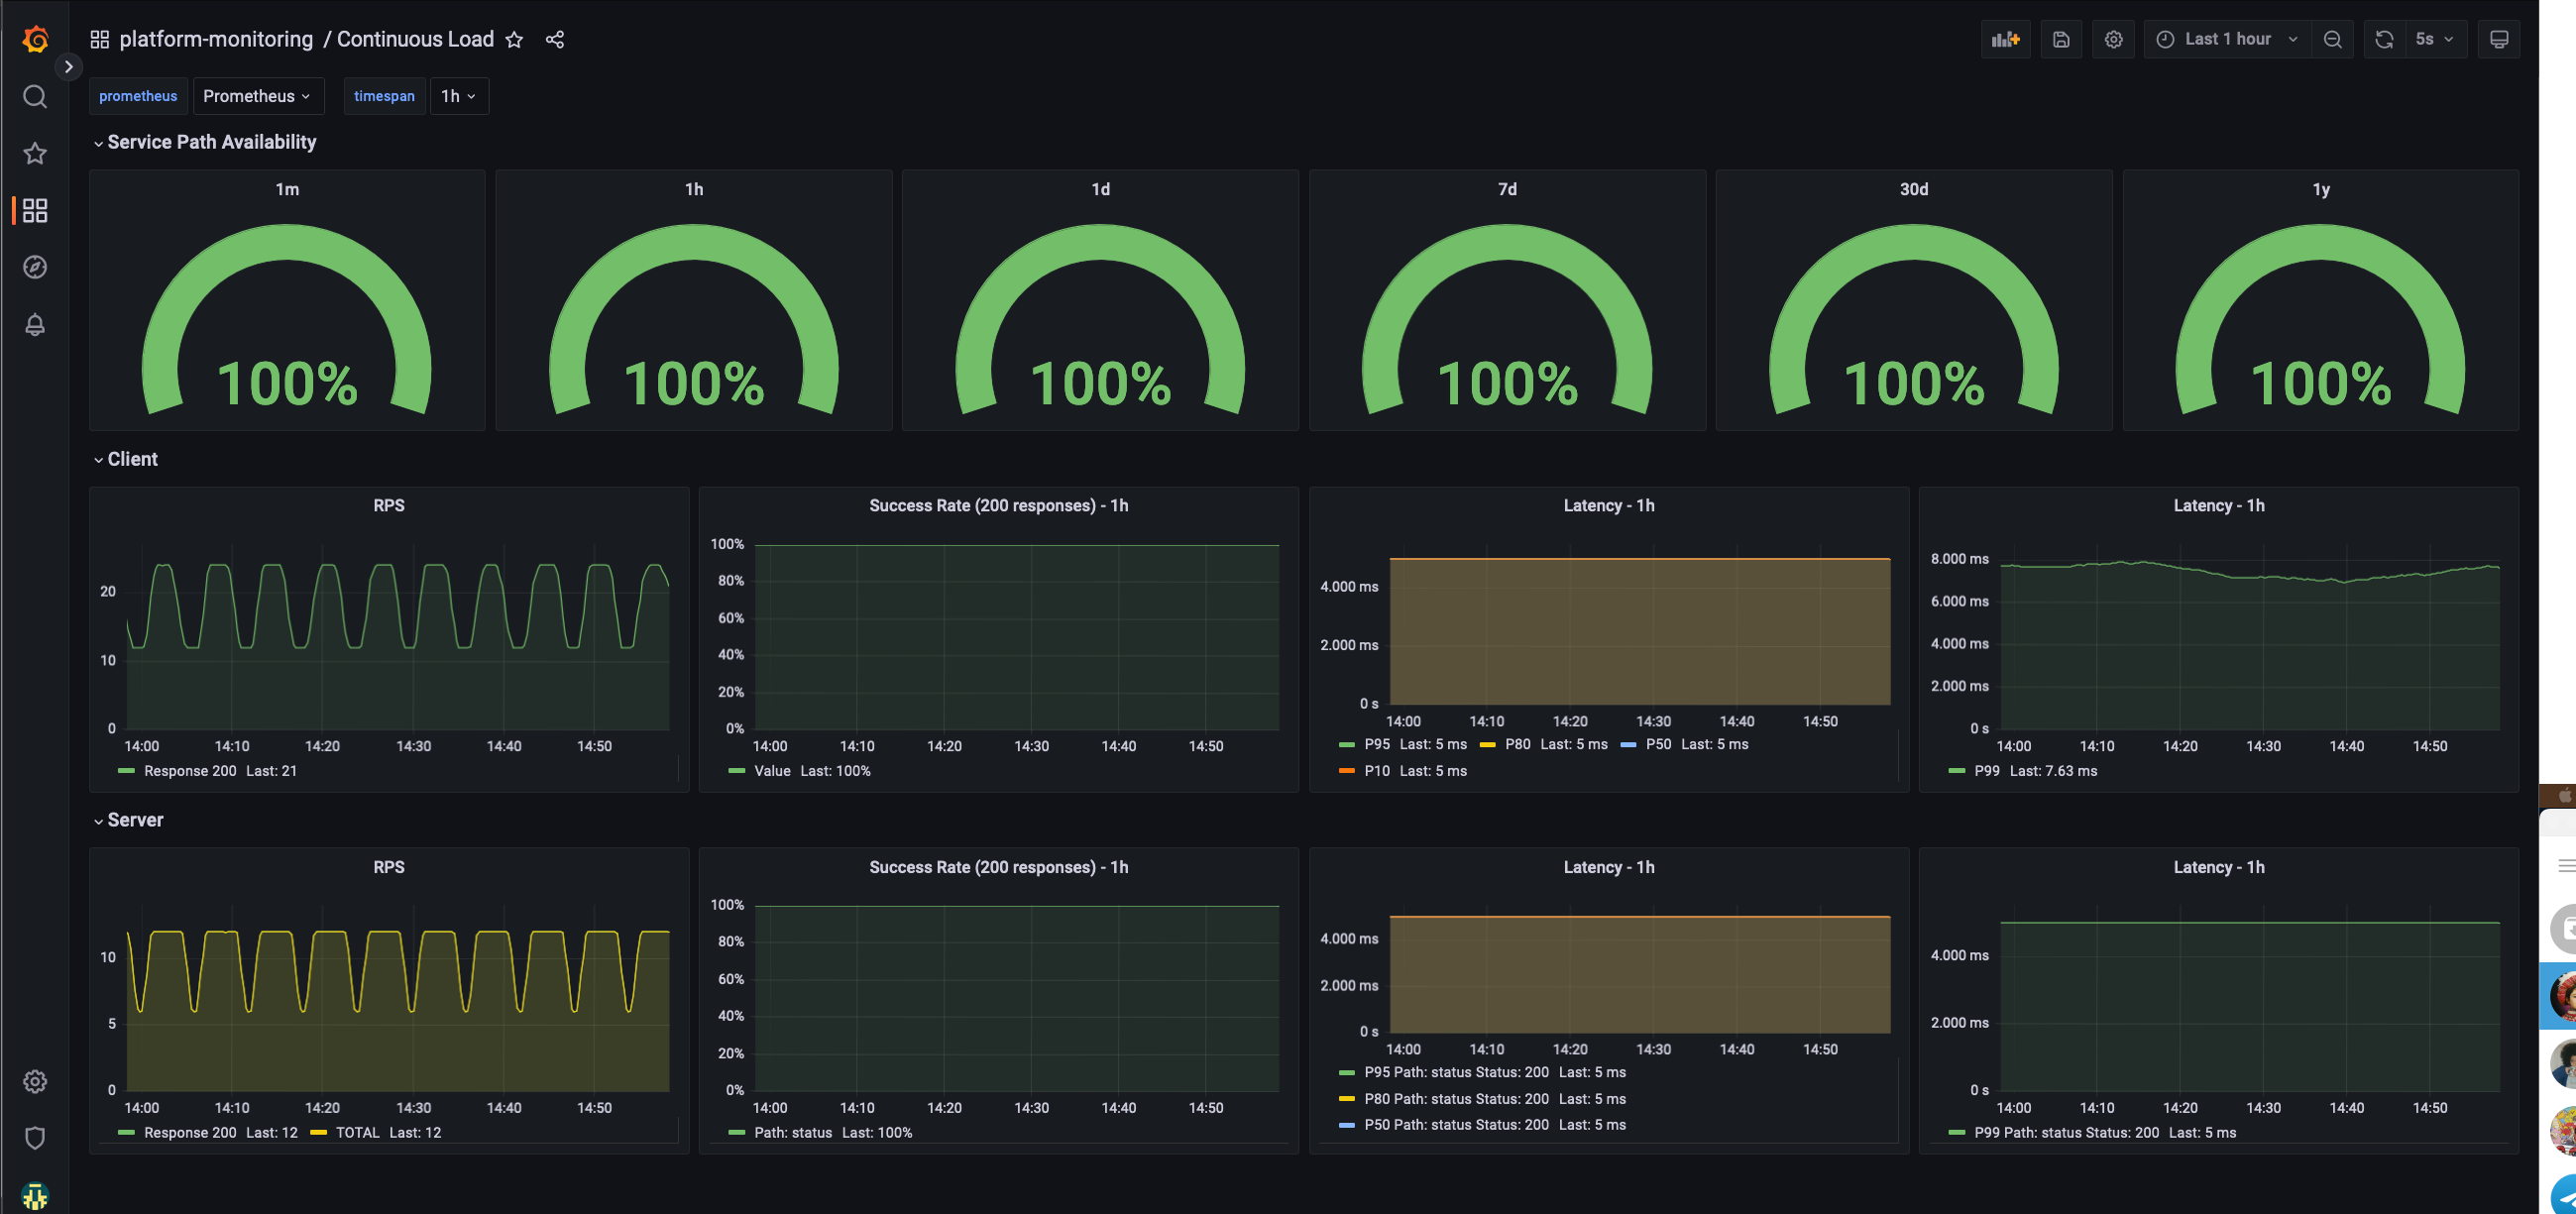
Continuous load Dashboard
Application-Specific Metrics
Examples of Application-Specific Metrics:
- Go GC statistics
- Request processing latency
- Number of processed jobs
Prerequisite
You should have deployed monitoring stack for your tenant. This monitoring stack consists of preconfigured Grafana and Prometheus instances.
To install monitoring stack, run the following command:
# Add helm repository
helm repo add coreeng https://coreeng.github.io/core-platform-assets
helm repo update

# Install the chart
helm -n {{ target-ns }} install monitoring-stack coreeng/monitoring-stack --set tenantName={{ your-tenant-name }}
To upgrade installed monitoring stack, run the following command:
#Upgrade installed chart
helm -n {{ target-ns }} upgrade monitoring-stack coreeng/monitoring-stack --set tenantName={{ your-tenant-name }}your-tenant-name - name of the tenancy to be monitored. Prometheus will look for PodMonitors/ServiceMonitors in
subnamespaces of this tenant.
Monitoring Application
To monitor start monitoring your application,
you have to create ServiceMonitor or PodMonitor resource for your application
and put monitoring/instance:: {{ your-tenant-name }} label on it.
By using tenant label, you define the target prometheus instance.
Here is the example:
apiVersion: monitoring.coreos.com/v1
kind: ServiceMonitor
metadata:
  name: some-service
  labels:
    app.kubernetes.io/name: some-service
    monitoring/instance: {{ your-tenant-name }}
spec:
  selector:
    matchLabels:
      app.kubernetes.io/name: some-service
  endpoints:
    - interval: 30s
      port: metrics
      path: /metrics
This configuration assumes that your application exposes metrics on metrics endpoint in Prometheus format.
Accessing Grafana and Prometheus
Grafana and Prometheus are not exposed by default. You have two options:
- Create Ingress resources for internal domain
- Port forward Grafana and Prometheus
Through Ingress
To enable ingress for monitoring services, you have to set the respective values during the installation of the monitoring-stack chart. It should look like this:
#Install helm chart
helm -n {{ target-ns }} install monitoring-stack coreeng/monitoring-stack \
    --set tenantName={{ your-tenant-name }} \
    --set internalServicesDomain={{ internal-services-domain }} \
    --set prometheus.ingress.enabled=true \
    --set grafana.ingress.enabled=true
To upgrade installed monitoring stack, run the following command:
#Upgrade installed chart
helm -n {{ target-ns }} upgrade monitoring-stack coreeng/monitoring-stack \
    --set tenantName={{ your-tenant-name }} \
    --set internalServicesDomain={{ internal-services-domain }} \
    --set prometheus.ingress.enabled=true \
--set grafana.ingress.enabled=trueyour-tenant-name - name of the tenancy to be monitored. Prometheus will look for PodMonitors/ServiceMonitors in
subnamespaces of this tenant.
internal-services-domain - domain of the internal services: internal_services.domain
- Grafana should be accessible by the URL:
{{ your-tenant-name }}-grafana.{{ internal-services-domain }} - Prometheus should be accessible by the URL:
{{ your-tenant-name }}-prometheus.{{ internal-services-domain }}
Through port forward
To port forward Grafana, run the command below and access it on http://localhost:3000
kubectl -n {{ target-ns }} port-forward service/grafana-{{ your-tenant-name }}-service 3000To port forward Prometheus, run the command below and access it on http://localhost:9090:
kubectl -n {{ target-ns }} port-forward service/prometheus-{{ your-tenant-name }} 9090Creating Grafana Dashboards
To create Grafana Dashboard you have to create GrafanaDashboard CR.
If you create it directly with UI, the changes will not be persisted for long,
so it’s advised to use Grafana UI for designing your Dashboard and then export it to CR.
When creating GrafanaDashboard, you have to specify Grafana instance selector, so Grafana Operator can inject your dashboard in Grafana instance:
apiVersion: grafana.integreatly.org/v1beta1
kind: GrafanaDashboard
metadata:
  name: my-grafana-dashboard
spec:
  instanceSelector:
    matchLabels:
      grafana: grafana-{{ your-tenant-name }}
...
In addition, in case your GrafanaDashboard is not in the same namespace as your monitoring stack, you have to specify an additional field:
apiVersion: grafana.integreatly.org/v1beta1
kind: GrafanaDashboard
metadata:
  name: my-grafana-dashboard
spec:
  instanceSelector:
    matchLabels:
      grafana: grafana-{{ your-tenant-name }}
  allowCrossNamespaceImport: "true"
...
Creating Grafana Datasources
To create Grafana Datasources you have to create GrafanaDatasource CR.
If you create it directly with UI, the changes will not be persisted for long,
so it’s advised to use Grafana UI for designing your Datasource and then export it to CR.
When creating GrafanaDatasource, you have to specify Grafana instance selector, so Grafana Operator can inject your datasource in Grafana instance:
apiVersion: grafana.integreatly.org/v1beta1
kind: GrafanaDatasource
metadata:
  name: my-datasource
spec:
  instanceSelector:
    matchLabels:
      grafana: grafana-{{ your-tenant-name }}
...
In addition, in case your GrafanaDatasource is not in the same namespace as your monitoring stack, you have to specify an additional field:
apiVersion: grafana.integreatly.org/v1beta1
kind: GrafanaDatasource
metadata:
  name: my-datasource
spec:
  instanceSelector:
    matchLabels:
      grafana: grafana-{{ your-tenant-name }}
  allowCrossNamespaceImport: "true"
...
Using Grafana Plugins for Dashboards/Datasources
To create Grafana plugins for dashboards or datasources, you need to specify an additional field, plugins.
Due to an open bug in the Grafana Operator, when creating/updating/deleting Datasources/Dashboards CRs with plugins, you need to modify (e.g., change annotations) all applied CRs you created in order to trigger the reconciliation loop with a new hash and update Grafana immediately with all changes. Otherwise, you need to wait for the resyncPeriod you set on the CRs.
This is a temporary workaround until the bug is fixed.
Here is an example of a plugin for a datasource:
kind: GrafanaDatasource
metadata:
  name: my-questdb
spec:
  instanceSelector:
    matchLabels:
      grafana: grafana-{{ your-tenant-name }}
  plugins:
    - name: questdb-questdb-datasource
      version: 0.1.4
  datasource:
    name: questdb
    access: proxy
    type: questdb-questdb-datasource
    database: qdb
    url: my-questdb-headless.questdb.svc:8812
    user: admin
    jsonData:
      sslmode: disable
      maxOpenConns: 100
      maxIdleConns: 100
      connMaxLifetime: 14400
    secureJsonData:
      password: quest
Here is an example of a plugin for dashboards:
apiVersion: grafana.integreatly.org/v1beta1
kind: GrafanaDashboard
metadata:
  name: keycloak-dashboard
spec:
  instanceSelector:
    matchLabels:
      grafana: grafana-{{ your-tenant-name }}
  plugins:
    - name: grafana-piechart-panel
      version: 1.3.9
  json: >
  {
    ...
  }