Creating a tenancy is how you onboard onto Core Platform.
If you already have a tenancy, you can jump to new-app to deploy a new application.
Adding a tenancy
corectl tenants create
You’ll be prompted for the following information about your new tenant:
name - Name of your tenancy. Must be the same as your filename.
parent - Name of the parent tenant or root. Note: root tenant is created implicitly.
description - Description for your tenancy.
contactEmail - Metadata: Who is the contact for this tenancy?
environments - which of the environments in Environments Repo you want to deploy to
repositories - if you have no existing applications then leave this empty. If migrating then add the repos with your applications (comma separated GitHub links)
adminGroup - will get permission to do all actions in the created namespaces - optional
readonlyGroup - will get read-only access to the created namespaces - optional
Both adminGroup and readonlyGroup are optional fields.
However, without these set, the secret management feature will not work.
You can still have access to tenant’s namespaces by being in the parents admin and read-only groups,
as it will inherit permissions to access children’s resources, with the exception of the secrets.
You are encouraged
to use different adminGroup and readonlyGroup for each tenant because of cloud restrictions and security reasons.
Maximum number of duplicated adminGroup or readonlyGroup is 20.
Once you fill the form, corectl will create a PR in the Environments Repo with a new file for the tenancy.
Once the PR is merged, a configuration for the new tenant will be provisioned automatically.
Note
Groups need to be in the gke-security-groups group!
If you are a new tenant the the platform, you should create new admin and readOnly groups and either ask a platform operator to add them
to gke-security-groups or add those groups to an already existing member of that group like platform-readonly.
Accessing your namespaces
Once the above PR that corectl creates is merged everyone in the groups will have access to the namespaces created for that tenancy.
If you access the cluster from the local machine, you need to connect to the cluster.
The easiest way to do this is using corectl:
corectl env connect <env-name>
For example, to check a namespace for a tenancy named myfirsttenancy:
kubectl get namespace myfirsttenancy
NAME             STATUS   AGE
myfirsttenancy   Active   30s
Create application
Create a new application
The Core Platform with a single command will configure:
A new repository
A template application demonstrating full continuous delivery:
Versioning
Functional testing
Non-functional testing
Promotion between a set of standard environments
Deployment to production
After running this command, and triggering the resulting GitHub workflow you’ll have an
application ready to deploy to production on every commit!
new-app-name must be lower case, as Docker only allows lowercase letters for image names.
It will:
prompt you a few additional questions, including template for the application.
create a new repository using the selected template
configure the created GitHub repository, so P2P workflows will run without an issue
Developer workflow
Now you have an application deployed to production. You can make changes by raising PRs.
Raise a PR
Raising a PR will automatically build the app, push the docker image, and deploy it to
environments for functional, non-functional, and integration testing.
Merge the PR
Merges to main by default do the same as a PR, and additionally deploy to a stable dev namespace that
can be used for showcasing or integration testing.
Configuration
Configuration should be checked into your repository and injected to your application via environment variables.
Configuration can be broken into two categories:
Inject .Values.service.environmentVariables as environment variables to the application via a block in the containers: definition, in the Deployment manifest, like:
{{- if .Values.service.environmentVariables }}env:
{{- range $key, $value := .Values.service.environmentVariables }} - name: {{ $key }}value: {{ $value }} {{- end }}{{- end }}
Sensitive configuration, i.e. secrets, can be configured in GitHub, and passed to the applications as Environment Variables via the P2P pipeline.
Note
You will need to be in the admin role for the application’s repository to be able to configure variables and secrets. This will automatically be the case for any repository you have created via corectl app create.
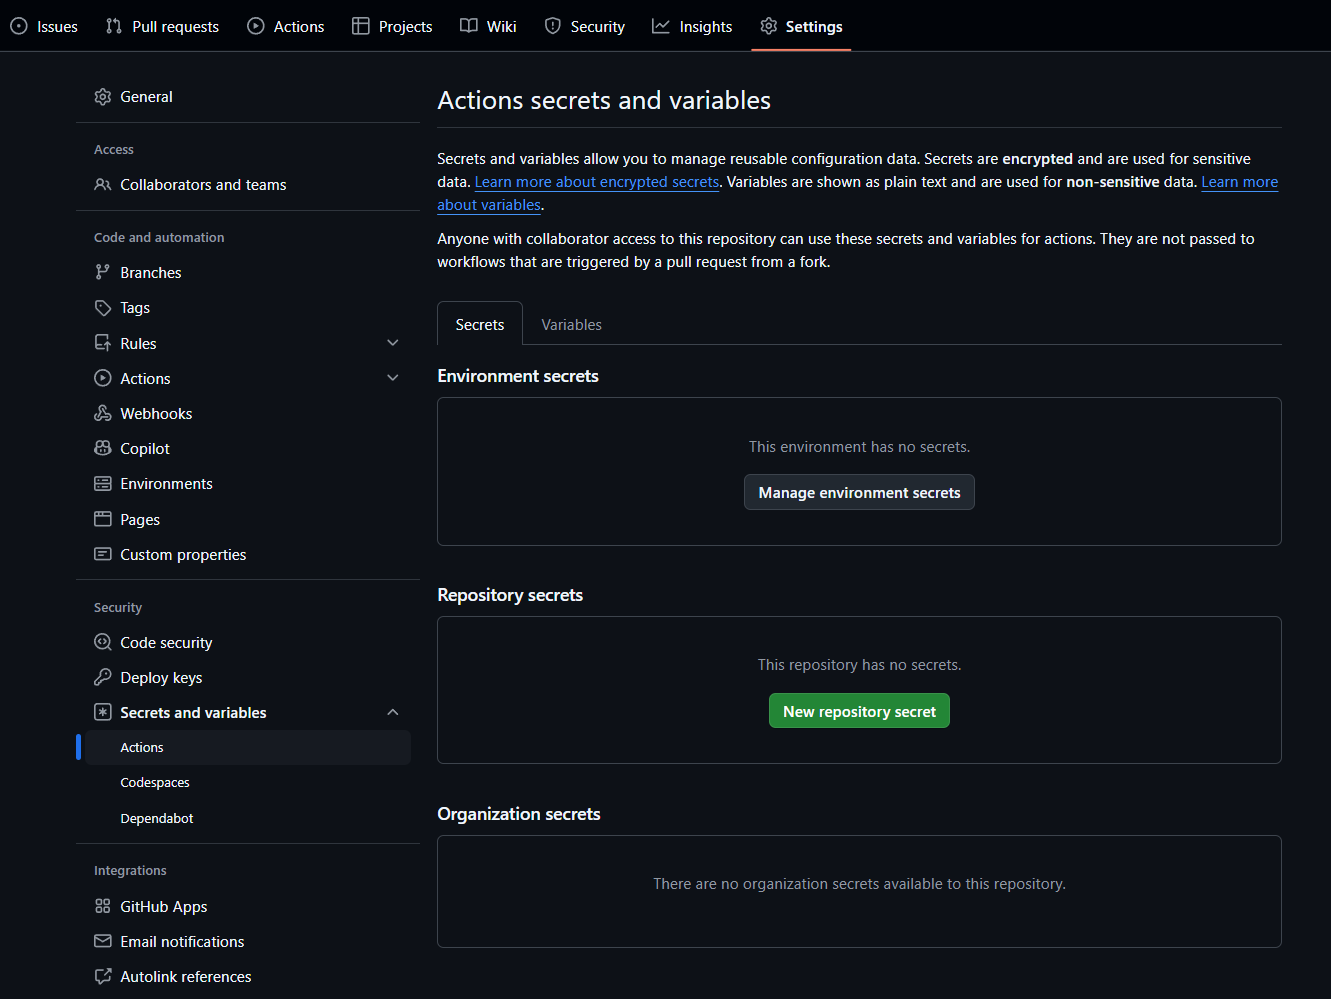
Secrets can be managed in the Settings tab on a repository, by navigating to: Settings > Secrets and variables > Actions.
Common Sensitive Configuration
On the repo for the application, navigate to: Settings > Secrets and variables > Actions and then the Secrets tab. Under Repository secrets click New repository secret. N.B. Unlike variables, secret values cannot viewed in the GitHub UI or logs.
In this example below we’ll make a secret called: GLOBAL_SECRET with a value of GLOBAL_PASSWORD-123
Environment Specific Sensitive Configuration
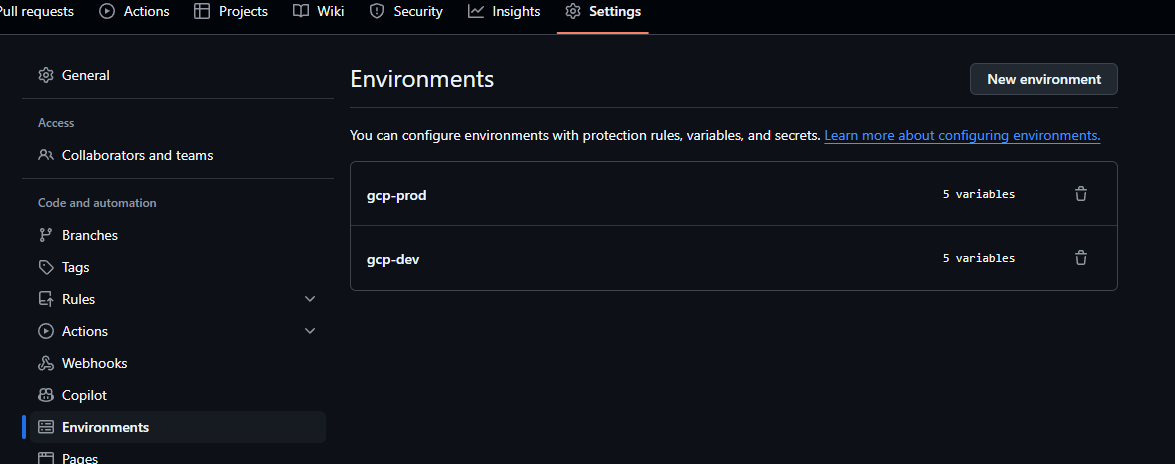
Environment specific secrets can be configured in GitHub via Settings > Environments, then choosing the correct platform environment.
If you need further isolation (e.g. different setup for Functional vs NFT test environments) that’s possible by configuring the secrets in dev and then only passing in specific variables to each Makefile target (covered below).
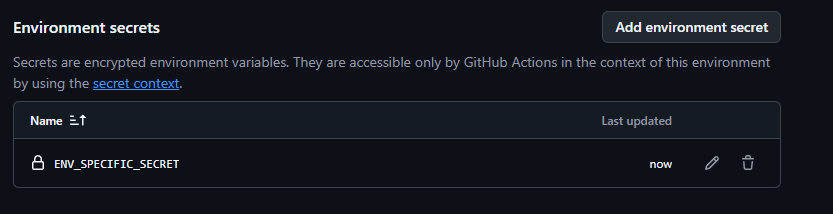
Environment specific secrets can be configured via Settings > Environments, then choosing an environment, and clicking Add environment secrets.
In this example below let’s add a secret called ENV_SPECIFIC_SECRET with a value of GCP-DEV-PASSWORD-123.
Full example
As per the above we’ll add both a common and environment specific secret in this example.
The above steps the secrets in to GitHub actions, but because we use re-usable workflows in GitHub actions additional steps are necessary to explicitly pass them through to the execution context that invokes the Makefile, and then changes are necessary in the Makefile to pass environment variables through to the application itself.
Updating the P2P workflow
Let’s say we want to pass our above example variables and secrets into the application running in the integration environment. As the integration test step is past of the fast feedback pipeline we’ll need to update the fast-feedback.yaml workflow (this lives in .github/workflows in the root of the repository)
To simplify the passing of variables and secrets to an application we can use a special variable called ENV_VARS. The platform P2P will automatically take everything that is configured in ENV_VARS and pass that in as environment variables, ENV_VARS expects to be a multi-line variable of the form KEY=VALUE on each line.
In GitHub workflows, secrets can be referred to via ${{ secrets.NAME }} and in yaml a multi-line variable is denoted via a | character.
So to pass in all of the above example variables into the P2P we’d modify the application’s fast-feedback yaml to add a secrets: block that defines all the variables we want in a multi-line env_vars: variable.
The entirety of the env_vars value is treated as a secret, so it will be hidden from any GitHub log output.
Every variable we add like the above will be passed into the execution context of the Makefile.
Updating the Makefile
The above steps have configured the variables and provided their values to the execution of the Makefile. The final step will be using them in our application via configuring them in the Makefile. The Makefile is in the root of the application repo and is the main interface between the P2P pipeline steps and the application code.
The Makefile has separate targets for each stage of the P2P pipeline. In this example we’re going to add variables to the application when running in just the integration environment - but exactly the same steps can be added for other environments (though extended test and prod will require their respective GitHub worfkflows to be amended in the previous step).
Variables can be passed into the application via additions like:
to the relevant Makefile target. So for a full example that targets the integration environment:
.PHONY: deploy-integration
deploy-integration: ## Deploy helm chart of the app to integration namespace helm upgrade --install $(app_name) helm-charts/app -n $(tenant_name)-integration \
--set registry=$(REGISTRY)/$(FAST_FEEDBACK_PATH)\
--set domain=$(BASE_DOMAIN)\
--set appUrlSuffix="-$(tenant_name)-integration"\
--set tag=$(image_tag)\
--set service.image=$(image_name)\
--set integration.image=$(image_name)-integration \
--set monitoring=$(MONITORING)\
--set dashboarding=$(DASHBOARDING)\
--set tenantName=$(tenant_name)\
--set appName=$(app_name)\
--set service.resources.requests.cpu=0m \
--set-literal service.environmentVariables.GLOBAL_SECRET="${GLOBAL_SECRET}"\
--set-literal service.environmentVariables.ENV_SPECIFIC_SECRET="${ENV_SPECIFIC_SECRET}"\
--atomic
helm list -n $(tenant_name)-integration ## list installed charts in the given tenant namespace
The application’s Kubernetes deployment manifest then needs to take care of supplying everything that is in .Values.service.environmentVariables as an actual environment variable - this is already done in our reference applications - and is covered in more detail above.
Validating the application has the expected variables
To validate all of the above has worked correctly, after the application is deployed to the relevant environment you can connect with corectl env connect <environment> and then run something like:
Grafana is available at grafana.internal_services.domain
The internal_services.domain is in the config.yaml for the environment you
want to access grafana for in your Environments Repo.
You can quickly access it by running:
corectl env open <env> grafana
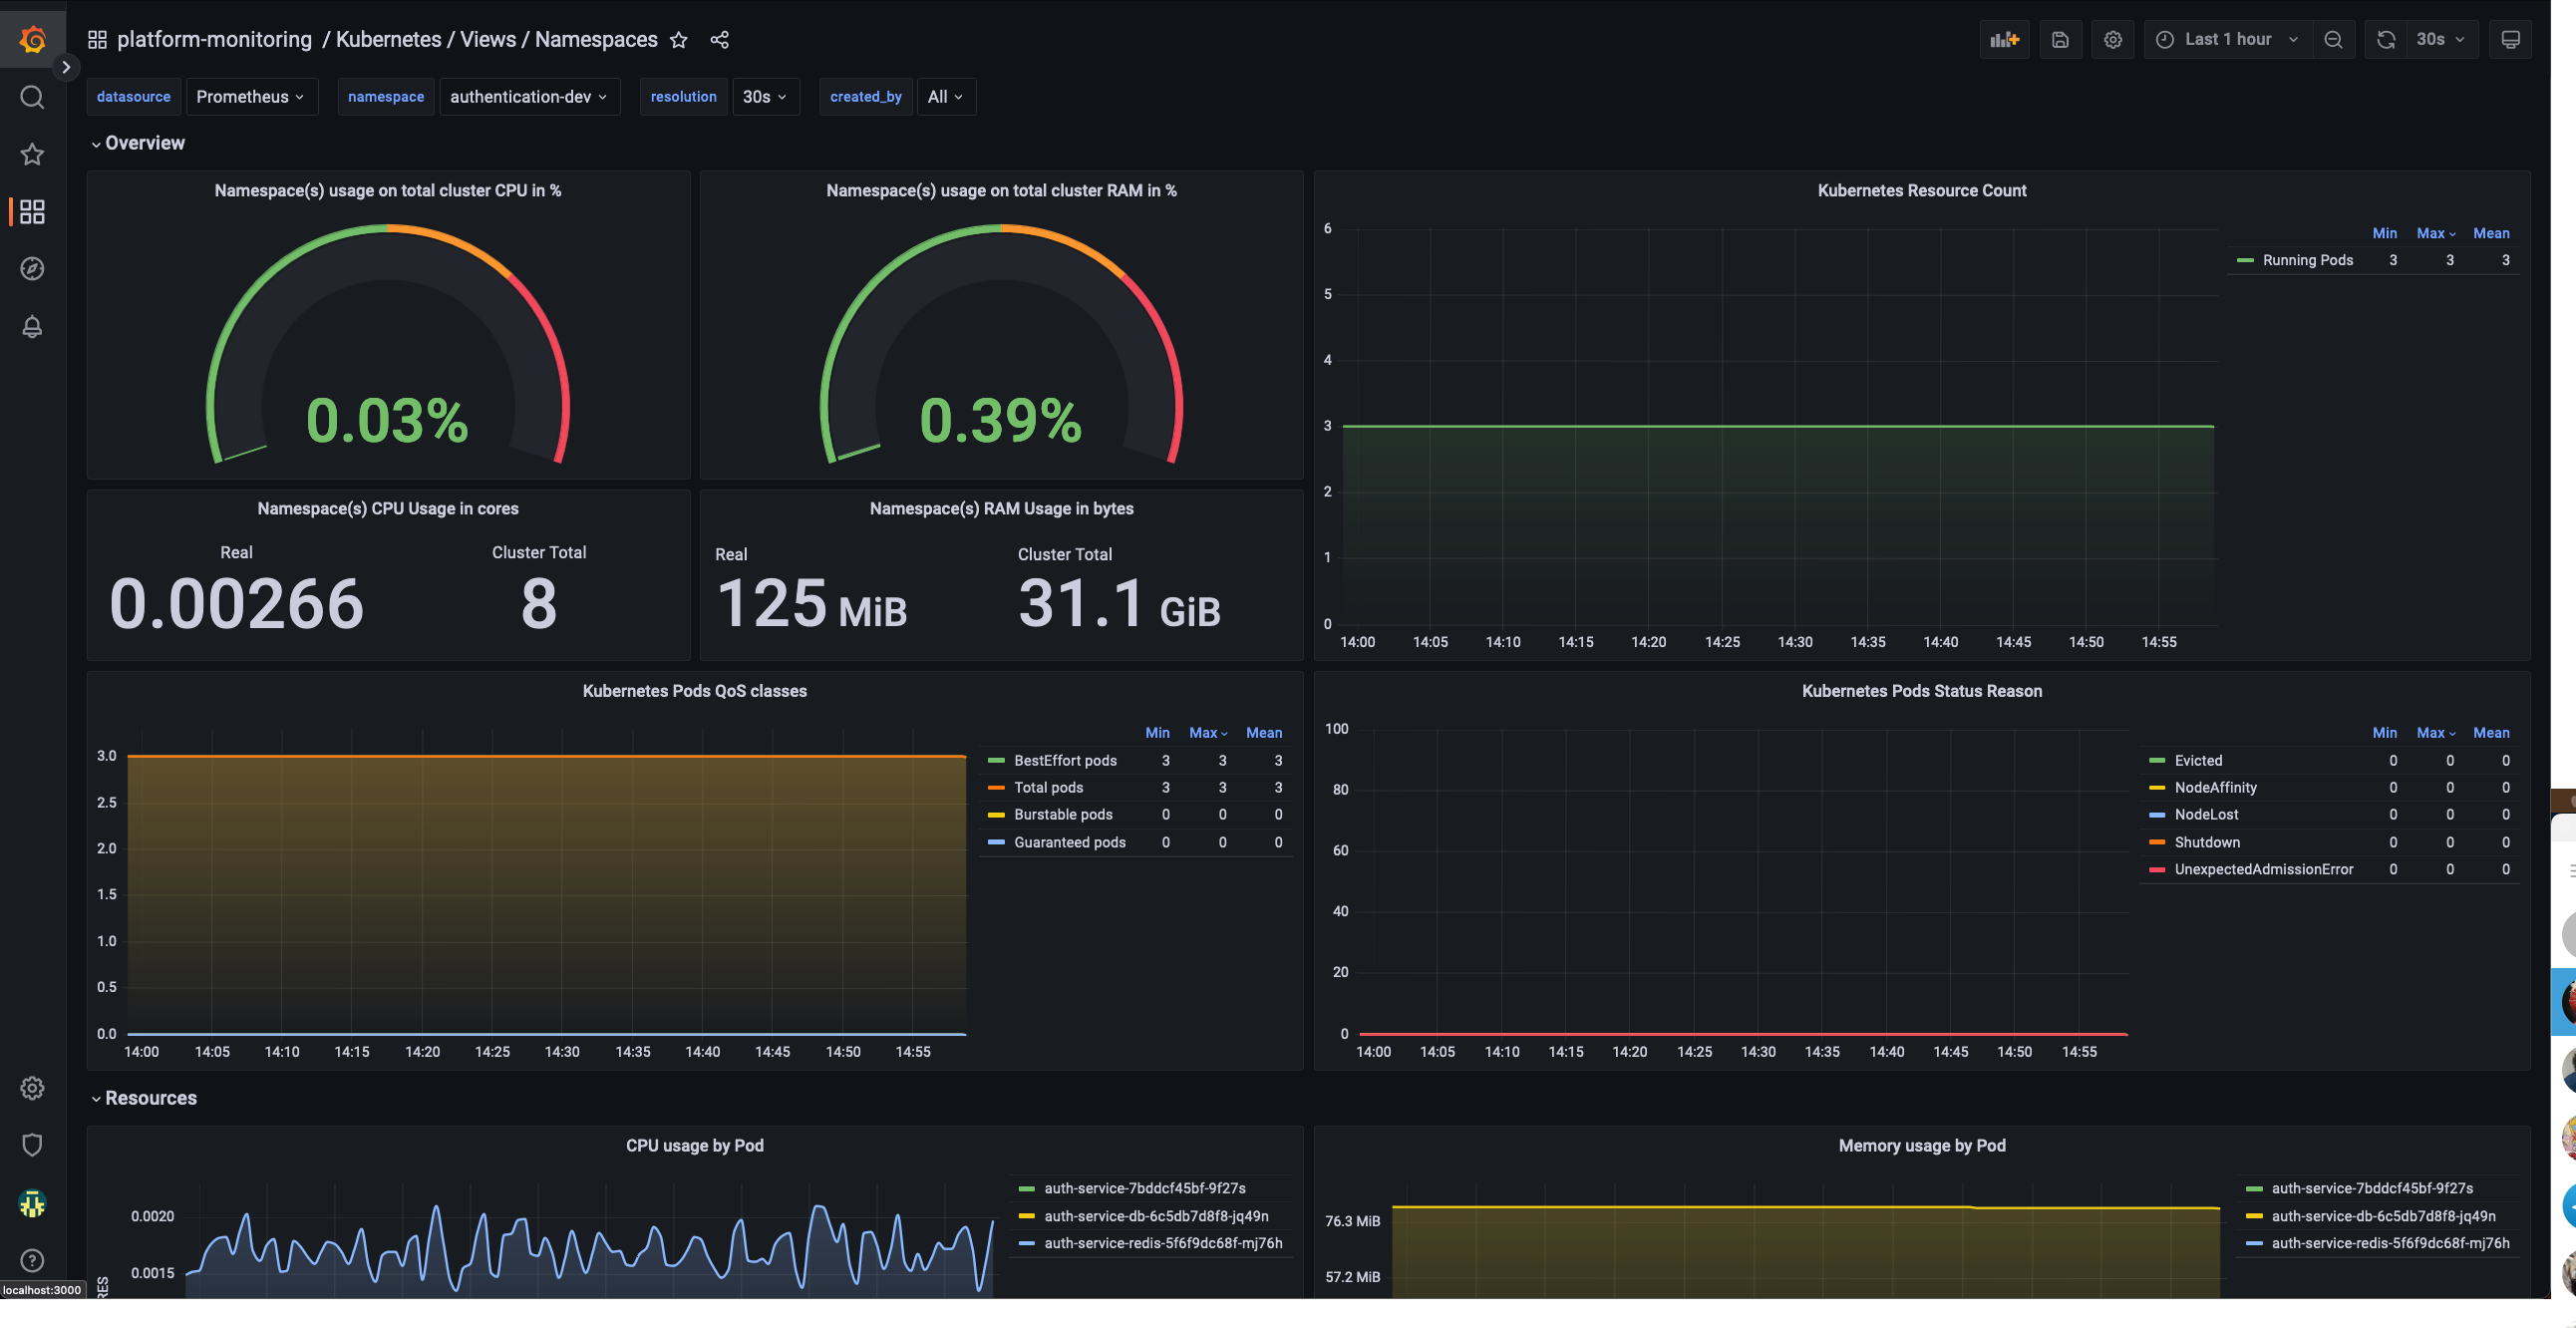
How can I monitor application resources?
This dashboard will allow a team to monitor their application namespaces and check their status. It will show data
like:
CPU Usage
Memory usage
Pod status
Pod restart count
Namespace Dashboard
How can I monitor the whole cluster?
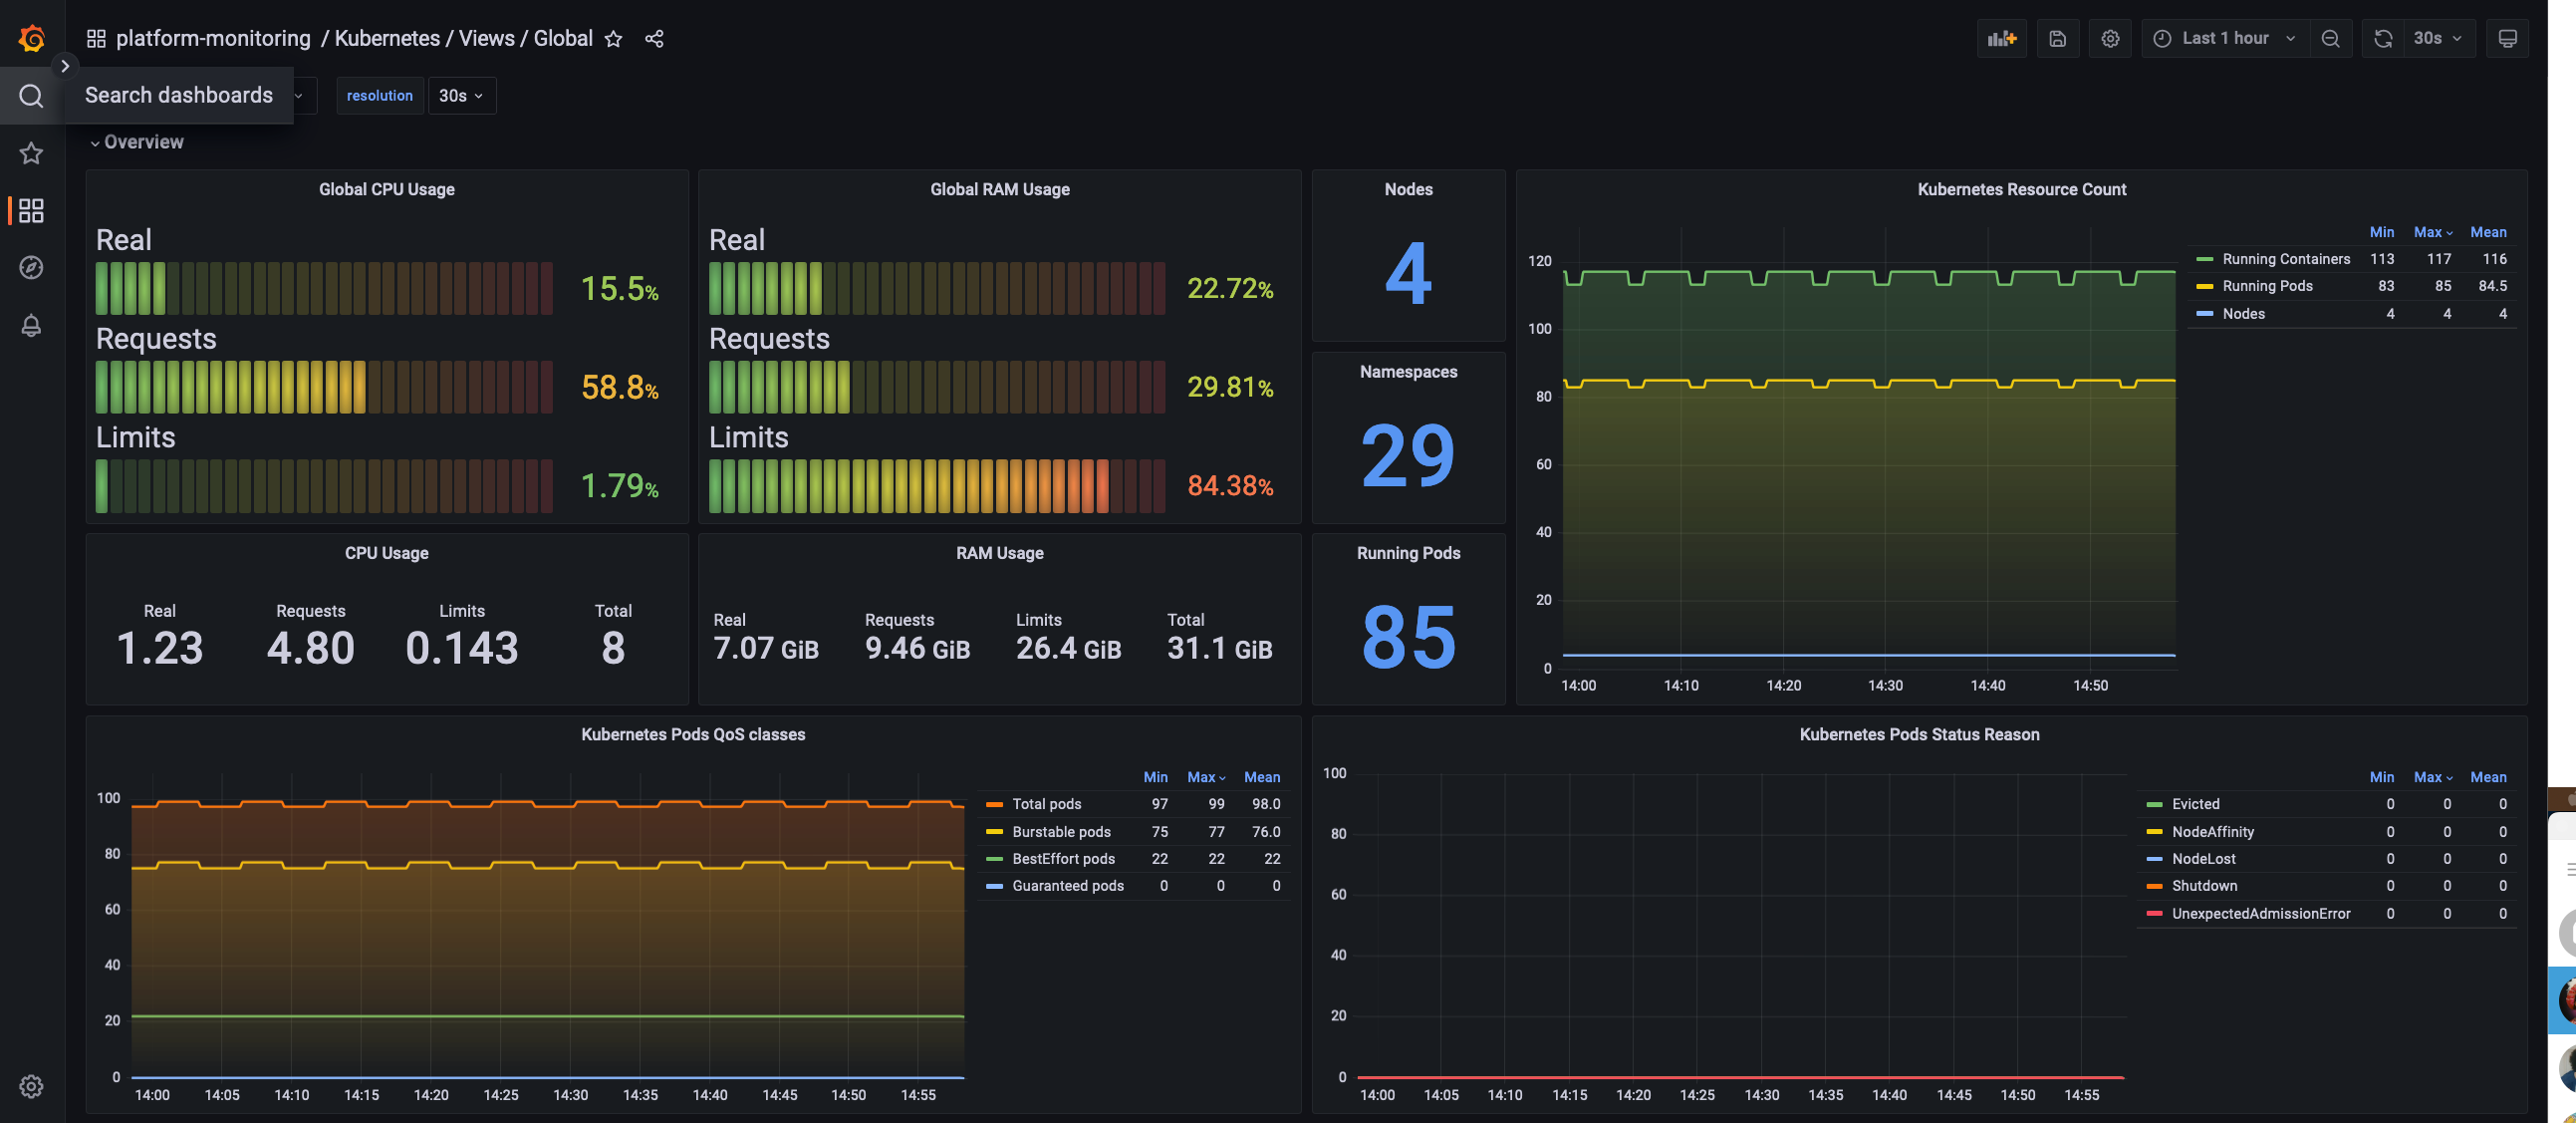
The global view dashboard will give you visibility over the cluster as a whole.
This will show you data like:
Nodes status
CPU and Memory usage
CPU and Memory Limits
CPU and Memory Reserved
Pod and namespace count
Pods status
Global Dashboard
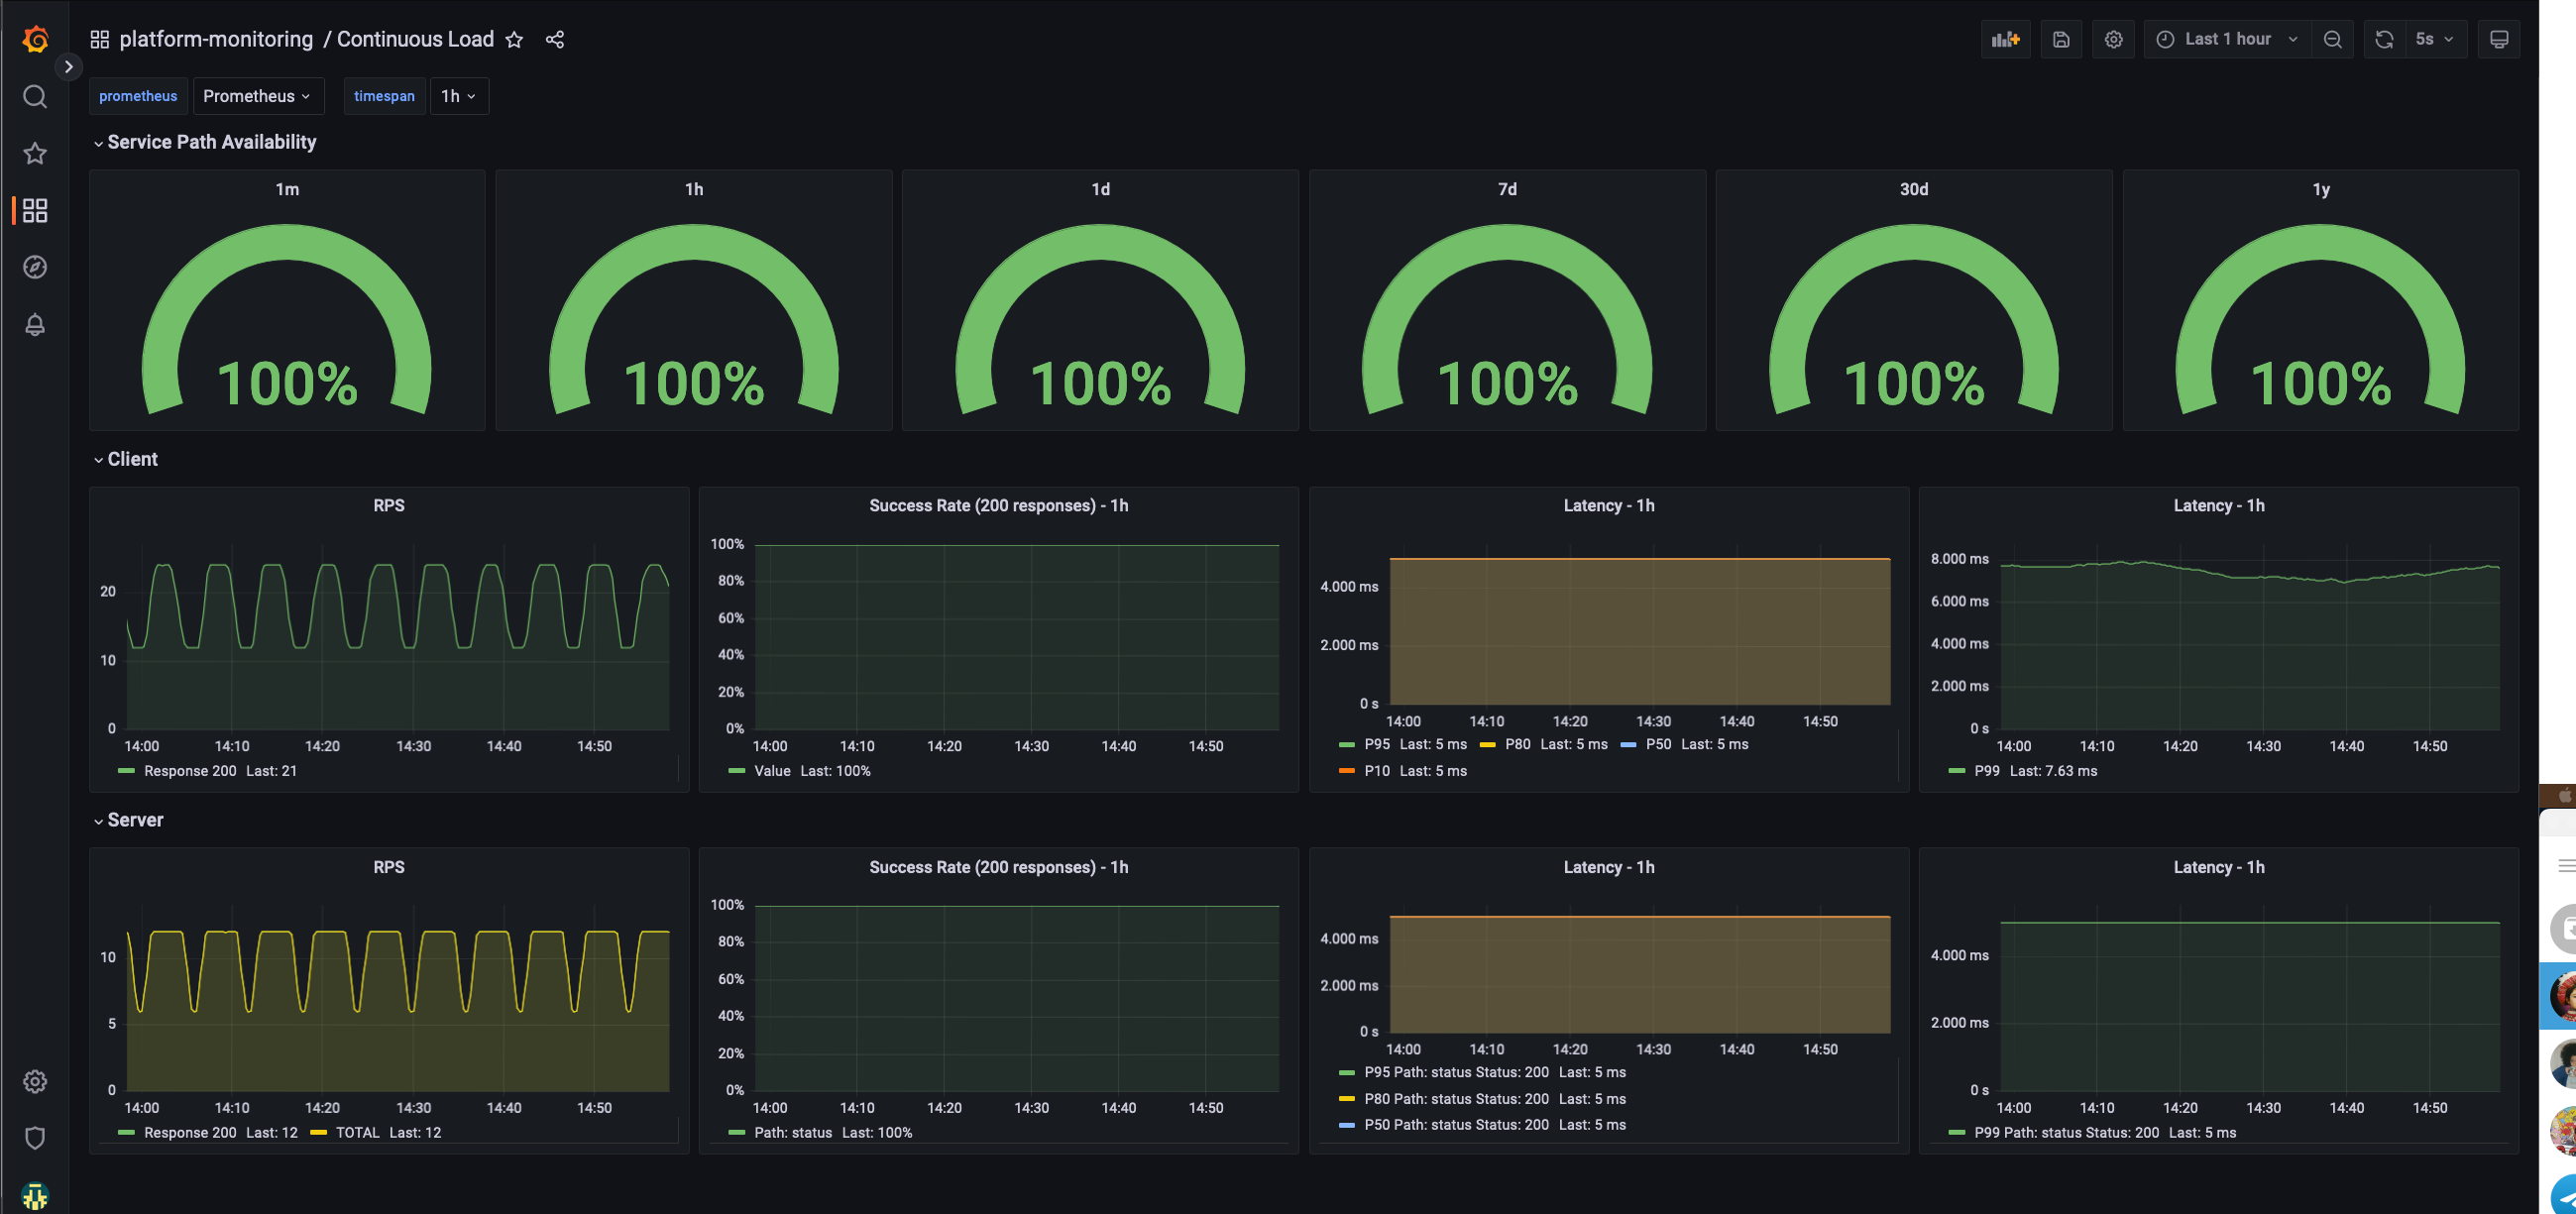
How can do I know if the environment is stable?
The platform-monitoring module also deploys a continuous load.
This will create k6 injectors and pods with podinfo, always with a stable throughput allowing us to monitor with
enough data the different percentils and any errors that occur to ensure that we can be proactive in investigating and
fixing any issues.
Continuous load Dashboard
Application-Specific Metrics
Examples of Application-Specific Metrics:
Go GC statistics
Request processing latency
Number of processed jobs
Prerequisite
You should have deployed monitoring stack for your tenant.
This monitoring stack consists of preconfigured Grafana and Prometheus instances.
To install monitoring stack, run the following command:
your-tenant-name - name of the tenancy to be monitored. Prometheus will look for PodMonitors/ServiceMonitors in
subnamespaces of this tenant.
Monitoring Application
To monitor start monitoring your application,
you have to create ServiceMonitor or PodMonitor resource for your application
and put monitoring/instance:: {{ your-tenant-name }} label on it.
By using tenant label, you define the target prometheus instance.
Here is the example:
This configuration assumes that your application exposes metrics on metrics endpoint in Prometheus format.
Accessing Grafana and Prometheus
Grafana and Prometheus are not exposed by default. You have two options:
Create Ingress resources for internal domain
Port forward Grafana and Prometheus
Through Ingress
To enable ingress for monitoring services,
you have to set the respective values during the installation of the monitoring-stack chart.
It should look like this:
To create Grafana Dashboard you have to create GrafanaDashboard CR.
If you create it directly with UI, the changes will not be persisted for long,
so it’s advised to use Grafana UI for designing your Dashboard and then export it to CR.
When creating GrafanaDashboard, you have to specify Grafana instance selector, so Grafana Operator can inject your
dashboard in Grafana instance:
To create Grafana Datasources you have to create GrafanaDatasource CR.
If you create it directly with UI, the changes will not be persisted for long,
so it’s advised to use Grafana UI for designing your Datasource and then export it to CR.
When creating GrafanaDatasource, you have to specify Grafana instance selector, so Grafana Operator can inject your
datasource in Grafana instance:
To create Grafana plugins for dashboards or datasources, you need to specify an additional field, plugins.
Important
Due to an open bug in the Grafana Operator, when creating/updating/deleting Datasources/Dashboards CRs with plugins, you need to modify (e.g., change annotations) all applied CRs you created in order to trigger the reconciliation loop with a new hash and update Grafana immediately with all changes. Otherwise, you need to wait for the resyncPeriod you set on the CRs.
This is a temporary workaround until the bug is fixed.
external-dns.alpha.kubernetes.io/target must match one of the ingress domains defined in environment config yaml file in Environments Repo
external-dns.alpha.kubernetes.io/hostname has to be a subdomain of the target
ingressClassName must be platform-ingress
Your service will now be available over the Internet over TLS.
To have a deeper understanding of how the Platform Ingress feature is designed, check the Platform Ingress Overview.
Troubleshooting
CreateContainerError: failed to reserve container name
The container runtime is unable to get the container into a running state so it’s stuck in pending.
A potential cause could be resource starvation on nodes. Check the cpu/memory usage of the node the pod is running on:
kubectl top node $(kubectl get pod <pod-name> -o jsonpath='{.spec.nodeName}')NAME CPU(cores) CPU% MEMORY(bytes) MEMORY%
gke-sandbox-gcp-sandbox-gcp-pool-18d01f3c-xhd8 174m 9% 2047Mi 33%
If the node cpu/memory usage is high, it’s possible the container runtime is struggling to find enough resources to be able to run the container.
Resolution
Ensure that your pod has cpu/memory requests set. This will allow the kube scheduler to to place your pods on better balanced nodes.
P2P GCP Auth Fail
I’ve got a new app, and when the P2P tries to authenticate with Google Cloud, it fails with an error like this:
Error: google-github-actions/auth failed with: retry function failed after 4 attempts: failed to generate Google Cloud federated token for projects/{{ project-number }}/locations/global/workloadIdentityPools/p2p-knowledge-platform/providers/p2p-knowledge-platform: (400){"error":"invalid_target","error_description":"The target service indicated by the \"audience\" parameters is invalid. This might either be because the pool or provider is disabled or deleted or because it doesn't exist."}
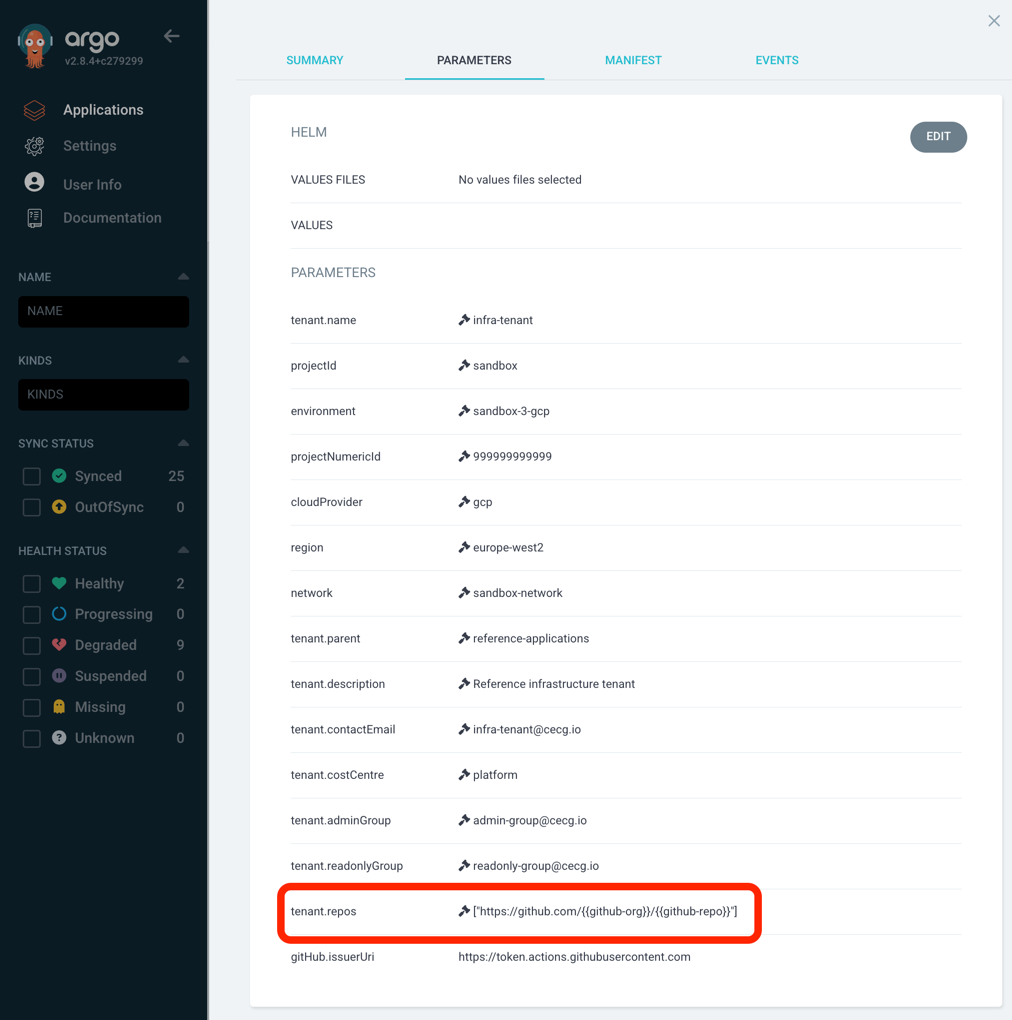
This is likely as the tenant definition has either not been deployed or doesn’t contain the GitHub repo. Without this the GitGub Action does not have permission to authenticate with GCP.
To find the problem with your tenant deployment, you can either:
use ArgoCD UI by accessing https://argocd.{{ internalServices.domain }}
kubectl CLI (may need a platform admin to run):
Note: all of this is internal implementation details of the platform and may change in the future.
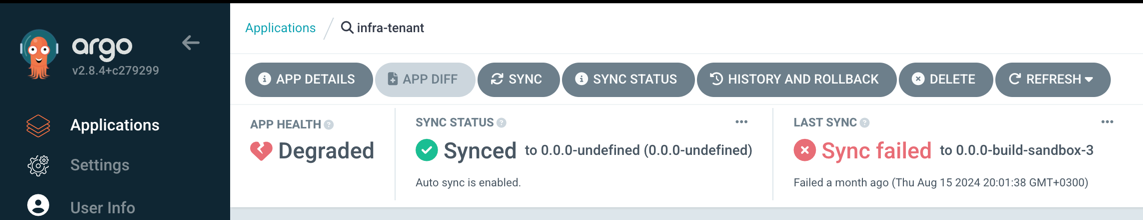
Check tenant deployment status
Does the tenant exist? Is it healthy? Is it synchedd?
With kubectl:
kubectl get -n argocd apps <tenant-name>
NAME                 SYNC STATUS   HEALTH STATUS
<tenant-name>        Synced        Healthy
With the ArgoCD UI:
Check tenant deployment status
If tenant is not synched/healthy, what is the reason?
With kubectl:
kubectl -n argocd describe app <tenant-name>
Why is it not synched/healthy will be in the output.
If you’ve added the repo to the tenant,
but it isn’t shown here, then likely the new tenant definition hasn’t been deployed to the environment.
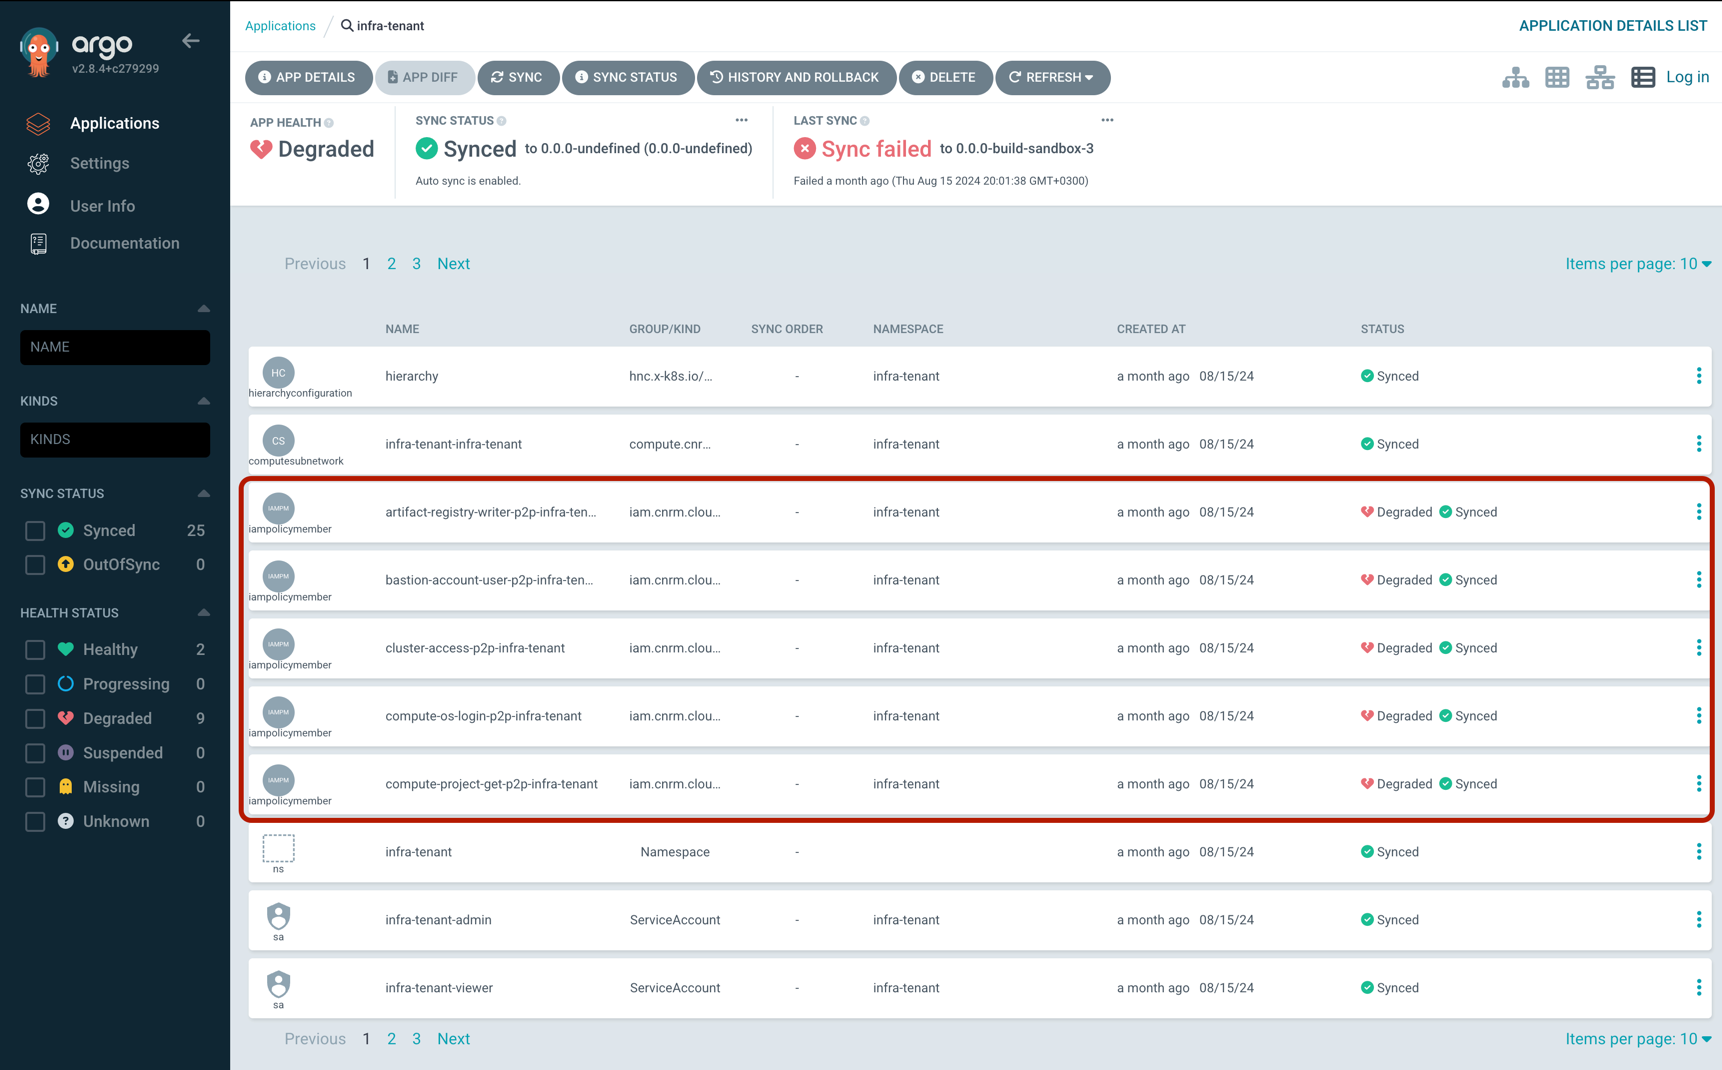
P2P Kubeconfig can not setup tunnel
ERROR: (gcloud.compute.start-iap-tunnel) Could not fetch resource:
 - Required 'compute.instances.get' permission for 'projects/{{ project-id }}/zones/europe-west2-a/instances/sandbox-gcp-bastion'
Follow the same steps as defined in P2P GCP Auth Fail to ensure the tenancy is setup correctly.
Then check that the IAMPolicyMember resources are properly syncing with GCP e.g. for a tenant called knowledge-platform
kubectl -n knowledge-platform get iampolicymembers.iam.cnrm.cloud.google.com                                                                                                                                                      │
NAME                                              AGE   READY   STATUS     STATUS AGE                                                                                                                                                                                            │
artifact-registry-writer-p2p-knowledge-platform   68m   True    UpToDate   68m                                                                                                                                                                                                   │
bastion-account-user-p2p-knowledge-platform       68m   True    UpToDate   68m                                                                                                                                                                                                   │
cluster-access-p2p-knowledge-platform             89m   True    UpToDate   89m                                                                                                                                                                                                   │
compute-os-login-p2p-knowledge-platform           68m   True    UpToDate   68m                                                                                                                                                                                                   │
compute-project-get-p2p-knowledge-platform        68m   True    UpToDate   68m                                                                                                                                                                                                   │
compute-viewer-p2p-knowledge-platform             68m   True    UpToDate   68m                                                                                                                                                                                                   │
iap-user-p2p-knowledge-platform                   68m   True    UpToDate   68m                                                                                                                                                                                                   │
workflow-identity-p2p-knowledge-platform          89m   True    UpToDate   89m
For the above error the compute-os-login-p2p-knowledge-platform one is responsible for giving access.
P2P Helm Numeric Value Error
Error
P2P fails on the helm upgrade step, while trying to apply the helm charts
ie running. helm upgrade --host=localhost --set port=123), results in error:
ERROR: json: cannot unmarshal number into Go struct field EnvVar.spec.template.spec.containers.env.value of type string
This is caused by your helm chart which contains values that are to be overridden, as for example if in our helm chart we had the below with:
host: {{ .Values.Host }}port: {{ .Values.Port }}
where these are meant to be passed over to kubernetes manifests, we need to guarantee that both of them are treated as string and not as numeric.
So if in the example above where, you where trying to override with --set port=123, this causes parsing issues on the helm and kubernetes side.
Solution
To fix this, we can safely “quote” the variables in question as per below:
Note:
those myfirsttenancy-[dev|functional|nft|integration] namespaces are lightweight environments.
You might not have those in the output if you didn’t create them.
Note: Instruction for installing the hns plugin for kubectl can be found here
Creating additional lightweight environments
You have permission to create as many lightweight environments in your tenancy.
All reference apps create at least:
functional - for stubbed functional tests
nft - for stubbed non-functional tests
integration - for integration tests
Typically, all lightweight environments are created in your dev cluster and only
a single namespace per application is in production.
To create a lightweight environment, in your tenancy namespace create:
The output should be the service account email starting with p2p-.
Once you have this you can, in your infrastructure project, assign permission to it so when
the pipeline next runs it can provision the infrastructure e.g. with terraform. This is only provisioning
that we recommend out side of the p2p as it is a chicken and egg problem.
When your make tasks are executed you will already be authenticated with gcloud so you don’t need to do any of that setup.
Annotate Kubernetes Service Accounts
To be able to impersonate the above service account, annotate your service account with the
Your pods should use this service account, then anytime they use a Google Cloud library they will assume the identity of the service account.
P2P
Infrastructure code should implement the steps of the P2P. But who do these work?
p2p-build
The build phase should package the whole infrastructure code in a docker image. That image should be versioned and pushed to the platform provided registry.
This image should have everything it needs to successfully deploy the infrastructure, meaning Terraform, Terragrunt, etc..
p2p-function / p2p-nft / p2p-integration
These steps should pull the image that was just pushed in the p2p-build. It then should do a docker run with passing different args.
On GithubActions, you’ll be authenticated to the platform, so you can reuse those credential to run using docker.
The above docker-apply task will copy the credentials on the application_default_credentials.json and then mount that as a volume in the docker run, making the commands in the docker use those credentials.
This setup makes promotion work in a similar way to the application. It will simply promote the versioned docker artifact across different registry paths/registries as deploy to extended-test and prod the latest versions promoted to those environments.
Autoscale application
Warning
Horizontal Pod Autoscaler and Vertical Pod Autoscaler should not be used together to scale the same metric. See using HPA & VPA in conjunction
With CloudSQL you can configure the connectivity and the authentication via IAM Service Accounts. For connectivity, please follow the setup access cloud infrastructure
Auth
Having a service account configured, we now need to tell the application running to use it. This can be done one of two ways
Google recommends using the the connectors whenever you can, but if it’s not available for the language you’re using, you can use the CloudSQLProxy.
There are a few things you need to have in mind:
On your database instance enable the flag cloudsql_iam_authentication (cloudsql.iam_authentication for postgres).
Create a CLOUD_IAM_SERVICE_ACCOUNT user on your database. This will create your username and on your configuration you’ll set it excluding the @<project_id>.iam.gserviceaccount.com, so in the previous example it would be myfirsttenancy-ca
Note
Service Account users are created without any Database permissions by default, and in order to do that, you need to manually give it the permissions you need.
In case you dont have any other built-in username, you can configure by running something like:
USER_NAME="test_user"PROJECT_ID="<PROJECT_ID>"gcloud config set project $PROJECT_ID
gcloud sql users create $USER_NAME --host=% --instance=mysql-nft --password=test
gcloud sql connect mysql-nft --user $USER_NAME
# You'll be inside mysql CLI at this pointuse reference-db;
GRANT ALL PRIVILEGES ON `reference-db`.* TO `myfirsttenancy-ca`@`%`;
This will:
Create a user
Allow the IP you’re connecting from to temporarily access the database
Grant all privileges on the created database to the SA user on all hosts
After this, feel free to delete the test_user user, or store its details in your preferred SM.
Give permissions to your CLOUD_SERVICE_ACCOUNT
In your automation for your infrastructure cloud account, give whatever permissions are required to your CLOUD_SERVICE_ACCOUNT.
For example, if you want it to access Cloud SQL it will need:
roles/cloudsql.client
roles/cloudsql.instanceUser
roles/serviceusage.serviceUsageConsumer
The first 2 are to have cloudsql client permissions and the last one is to be able to use a service that doesn’t not belong to the project.
Billing
To be able to connect, you need to specify to the client which billing account to use, as by default it will try to use the one where the SA is configured, which in this case will be one of the platform environments, but you want it to use your own project.
For terraform, you can add these 2 env vars:
For the application, something similar is required if you’re using IAM SA auth.
When creating a connector, you can specify by setting the quota project. In go, that will look like this:
Alternatively you can use the cloudsql proxy and pass this as an argument --quota-project project.
Connect to MemoryStore
Connectivity
Creating and accessing a Database like Redis with PSA is simpler that cloudsql.
After you configure your tenancy network,
you’ll be able to create your redis instance.
There, you’ll chose PRIVATE_SERVICE_ACCESS
as the connection mode and configure the Core Platform’s network as the authorized network
which is constructed like
Once configured and deployed, the redis instance will be given a private IP from the PSA range and you’ll be able to reach it without any more configurations from your pods.
Auth
Being part of the same network, this will not be using IAM SA Auth, nor is it support. Auth is disabled by default and can be enabled. Read more about Redis Auth here
Disadvantages
Being on the same network as the platform, means that any pod inside that network will have connectivity to redis, whether it’s the same tenant or not.
The way to prevent this will be to have Network Policies with default deny to the PSA range and only enabling it for a specific tenant.
Create GCP Project for Tenant Infrastructure
Description
The goal of this How-To is to understand how and why you as a tenant can create a project under the tenant-infra folder for each environment.
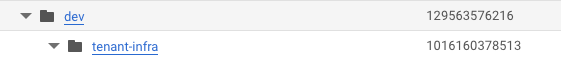
If take a look at the projects in the GCP console, you’ll see that each environment has a tenant-infra folder:
On that folder, each tenant can create different GCP projects where they can create the custom infrastructure. This one you can segregate the ownership and costs of that infrastructure to a specific tenant.
How?
First, you’re going to need some information as pre-requisites:
Knowing the parent project (projectId in environments config.yaml) - PROJECT_ID
Knowing the folder ID of the tenant-infra folder - FOLDER_ID
Know the billing account ID. This can be an existing one, or you can create a new one via the UI - BILLING_ACCOUNT_ID
Have a unique name for the new project. If it’s not unique the creating command with fail and you can try another name. - NEW_PROJECT_ID
Creating the project
With the above data, using gcloud is the easiest way to create a new project.
Warning
If you don’t have permissions to run this, you might need to reach out to your Platform Operator or Cloud Administrator.
Setting a low memory limit can lead to Out Of Memory kills of your application.
Note
Setting resource requests can prevent Out of Memory (OOM) and CPU throttling for your workloads. It’s usually best to not set CPU limits. See memory vs cpu for more details.
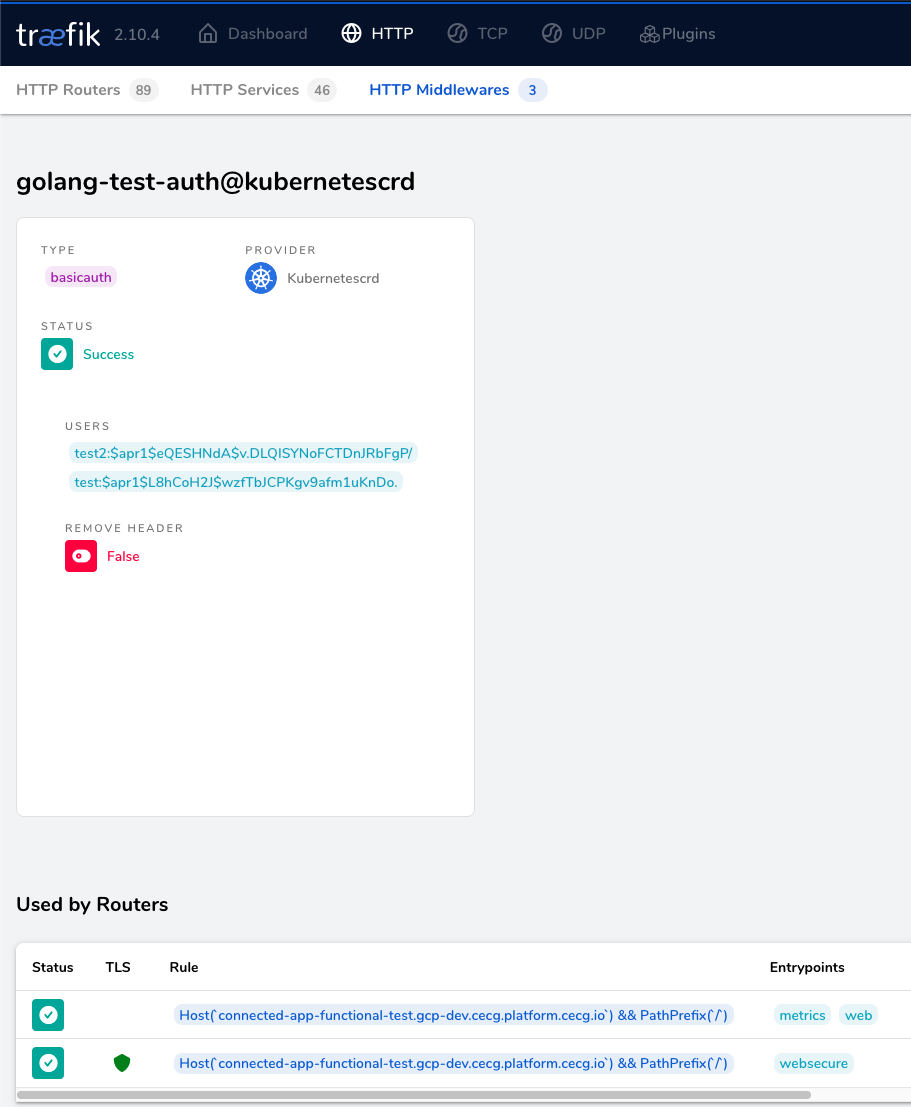
This contains 2 users, one on each line. The password here is expected to be encrypted and then the whole string encoded to base64. You can use the command htpasswd -nb <user> <password> | openssl base64 to generate each user.
Then you need to create a middleware.traefik.io object. If on your resource you come across a middleware.traefik.containo.us, that is an older version of Treaefik’s CRD. It will still work but it will be deprecated in the future.
The Middleware will look like this:
After this, we can reference it in our Ingress object with the annotationtraefik.ingress.kubernetes.io/router.middlewares: <middlewareNamespace>-<middlewareName>@kubernetescrd, for example:
apiVersion: traefik.io/v1alpha1kind: Middlewaremetadata:
name: <middlewareName>namespace: <middlewareNamespace>spec:
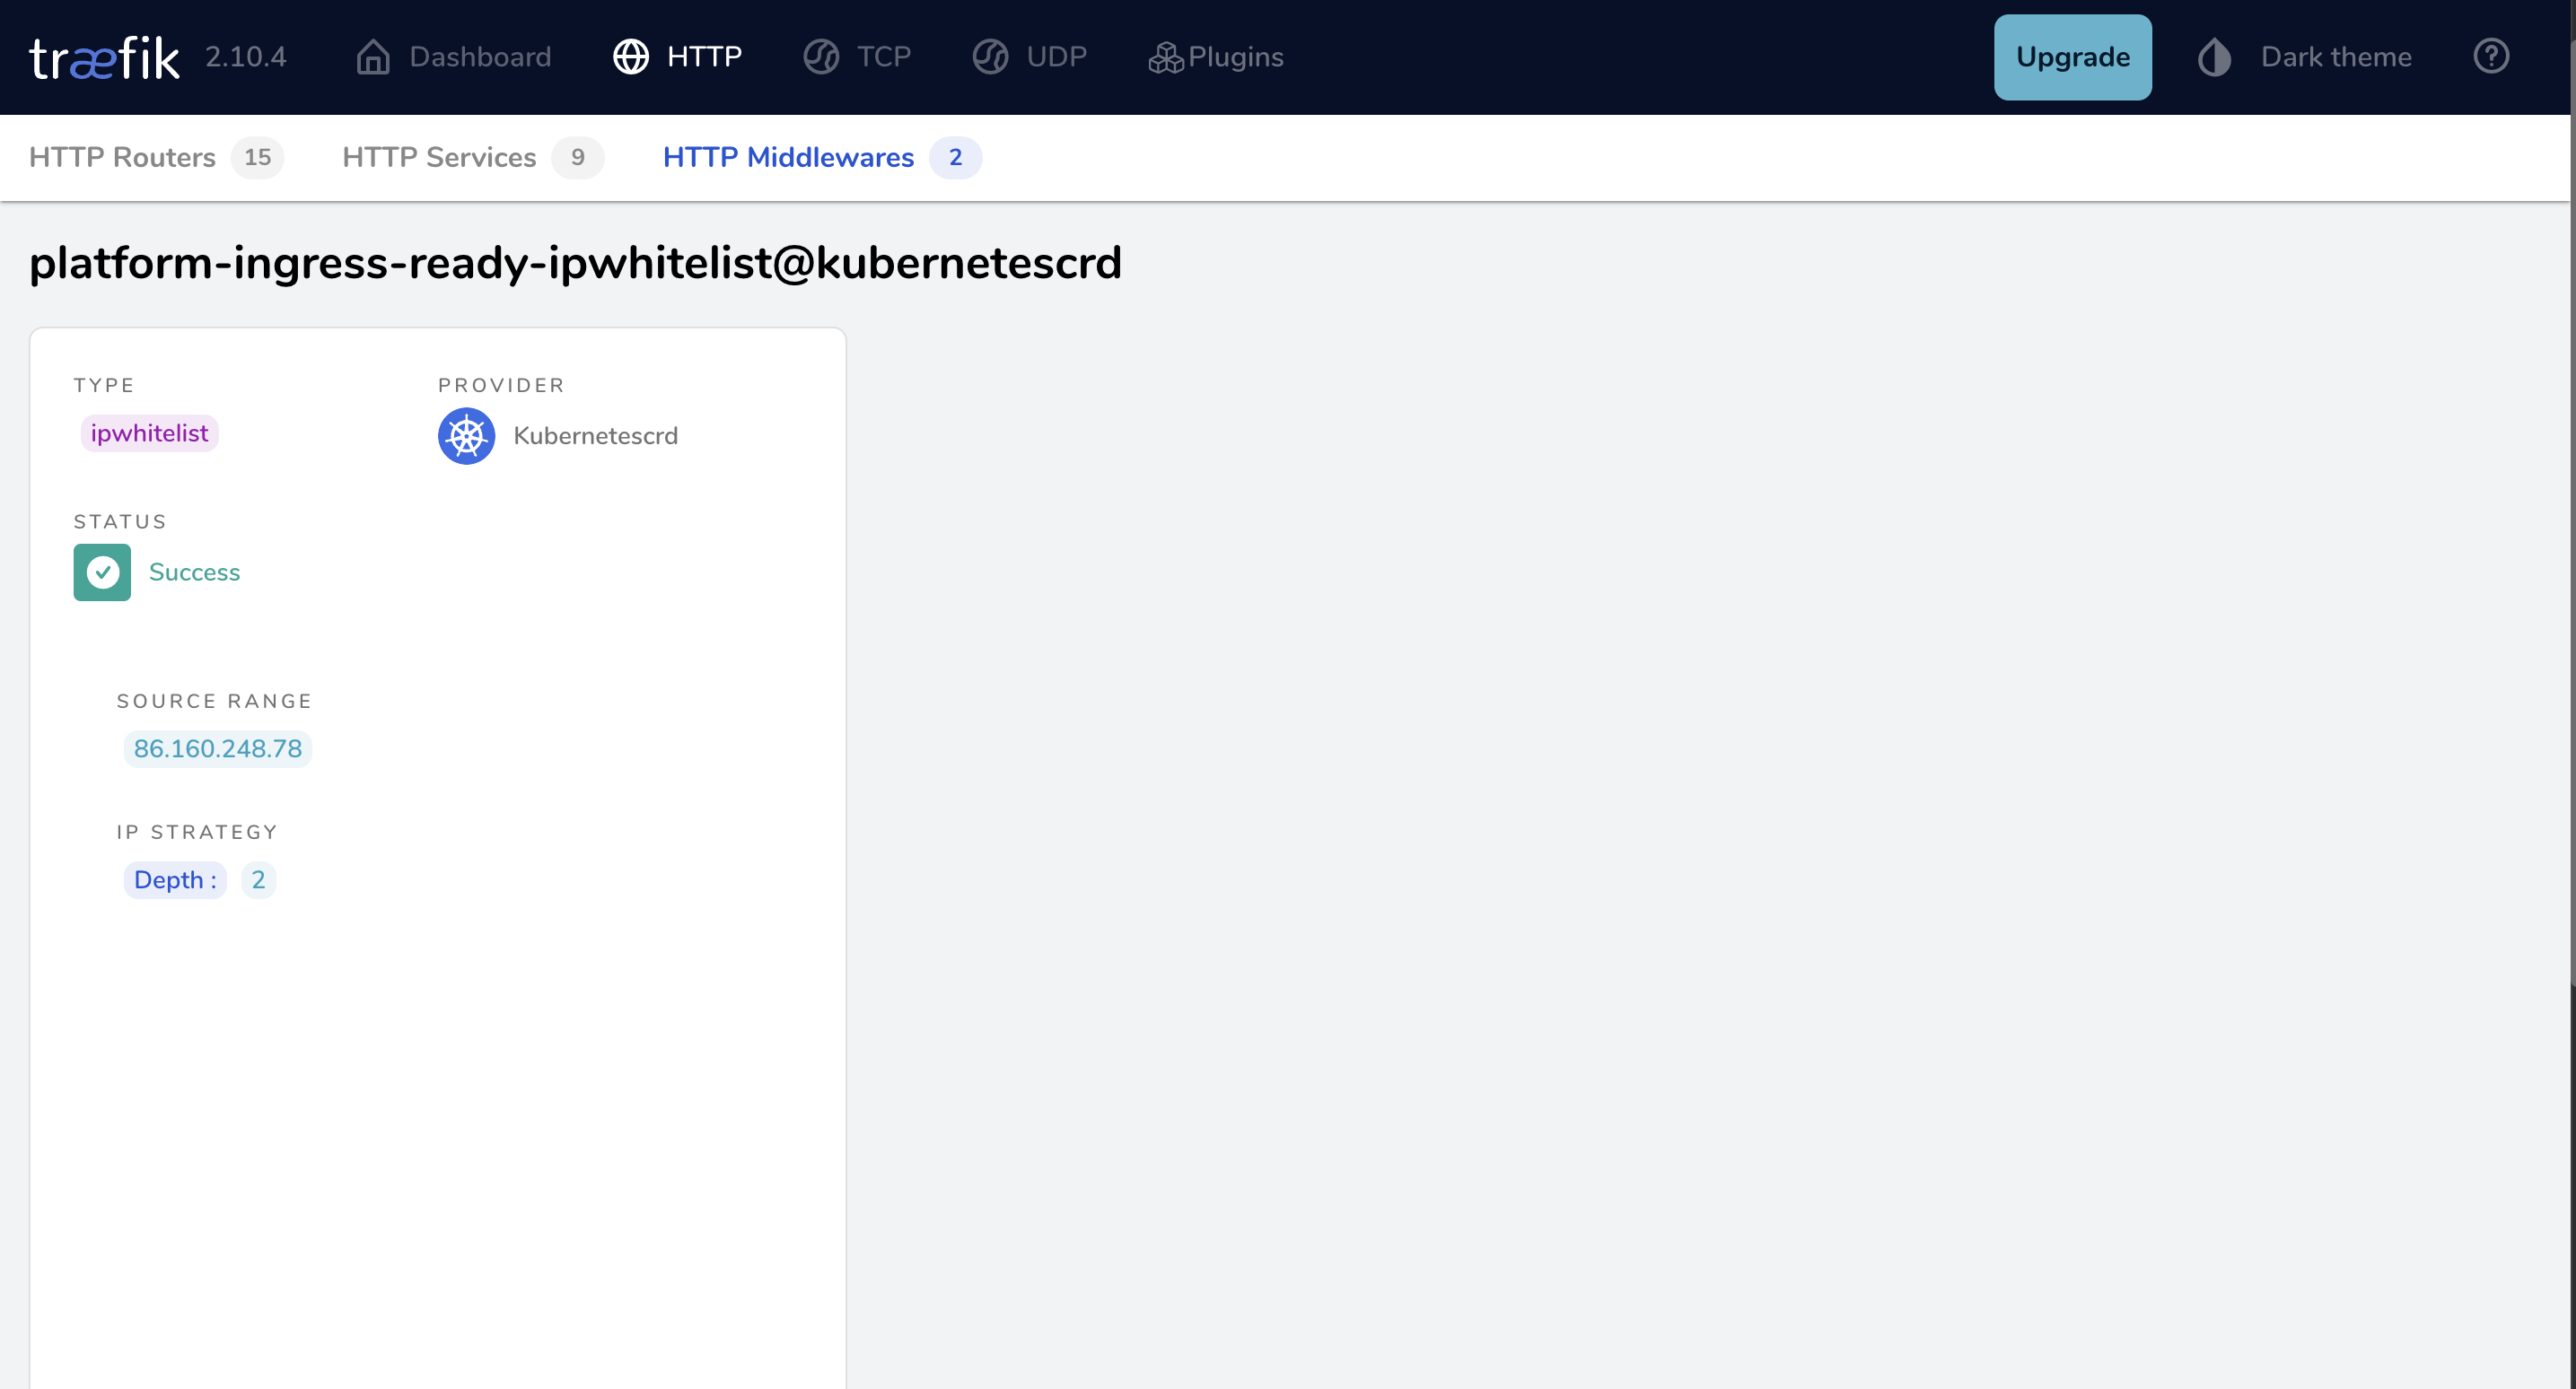
ipWhiteList:
ipStrategy:
depth: 2# depth is required as request is forwarded from load balancer. See https://doc.traefik.io/traefik/middlewares/http/ipwhitelist/#ipstrategydepth for more detailssourceRange:
- <ip-address> - <ip-address>
Use Middleware in Ingress
Reference middleware in our Ingress object with the annotationtraefik.ingress.kubernetes.io/router.middlewares: <middlewareNamespace>-<middlewareName>@kubernetescrd, for example:
apiVersion: networking.k8s.io/v1kind: Ingressmetadata:
labels:
annotations:
external-dns.alpha.kubernetes.io/hostname: foo.gcp-dev.cecg.platform.cecg.io# change this to point to your hostnameexternal-dns.alpha.kubernetes.io/target: gcp-dev.cecg.platform.cecg.io# change this to point to your domaintraefik.ingress.kubernetes.io/router.middlewares: <middlewareNamespace>-<middlewareName>@kubernetescrdname: foo-appnamespace: foospec:
ingressClassName: platform-ingressrules:
- host: foo.gcp-dev.cecg.platform.cecg.iohttp:
paths:
- backend:
service:
name: foo-serviceport:
number: 80path: /pathType: ImplementationSpecific
After you apply this, only users with whitelisted IPs will be able to use that ingress URL.
Debugging
Dashboard
To validate that your Middleware has been applied successfully, check the Traefik Dashboard and ensure that it contains no errors.
Traefik Dashboard
Logs
Check traefik logs to see whether request is being whitelisted:
Traefik Logs
Login Docker Hub
Login to Docker Hub
Why do I need this?
Docker Hub has pull rate limits. If you’re not logged in, you will have a shared quota for those pulls which you will not control.
To avoid this you should be using either a team account or organization account to login as part of the p2p-build step in the Makefile.
By having your own account, you’ll ensure only that you have your own quota that is not shared by anyone so you’ll have more predictable limitations
How to login
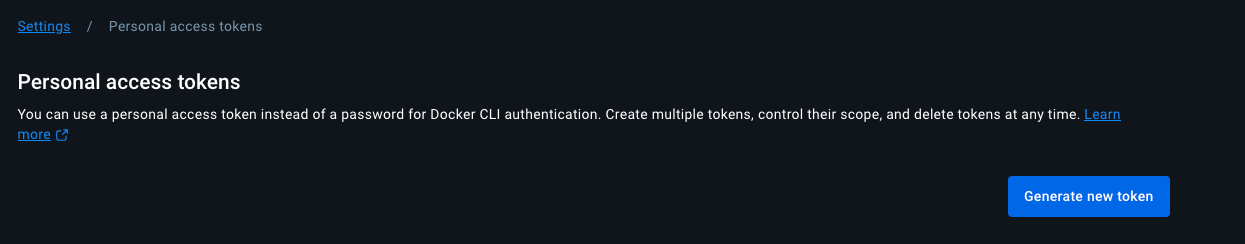
After you create an account, you’ll need to have to create a Personal Access Token. You can follow that link or go to Account Settings->Personal access token.
You can then generate a new one with Public Repo Read-only Access permissions.
Configuring p2p
In order to use the the token, we’ll create a new secret in GitHub and call it DOCKERHUB_PAT. You can also store the username there with DOCKERHUB_USER.
Then we’ll modify our fast-feedback.yaml workflow to include that secret as an environment variable. Don’t worry, this will still be encoded and treated as a secret
Now we need to jump over to the Makefile and locate our p2p-build task.
We’ll create a new task docker-login and add it as a dependency to the p2p-build
.PHONY: p2p-build
p2p-build: docker-login build-docker ## Builds the service image and pushes it to the registry.PHONY: docker-login
docker-login: # Login to docker echo $(DOCKERHUB_PAT) | docker login -u $(DOCKERHUB_USER) --password-stdin
Is the namespace you’re trying to connect from listed there?
Does the Service Account name match? The Kubernetes Service Account being used by your deployment/pod needs to match exactly what is defined there?
Tenant Provisioner status
In case all above looks correct, there might be exceptional issues with the tenant provisioner. In this case, you should reach
out to a platform operator and ask them to check the status of the tenant provisioning of your tenant. This functionality will be added to corectl in
a future release.
Validate permissions
Failure on CI
If the issue is on CI creating the resources/connecting to your account, it might be an issue with the configured service account.
Out of the box, the SA using on GH actions will work to deploy to your tenant’s namespace in the Kubernetes Cluster, to use the same SA to deploy your infrastructure
in a different GCP account, you need to ensure that SA has permission to do so.
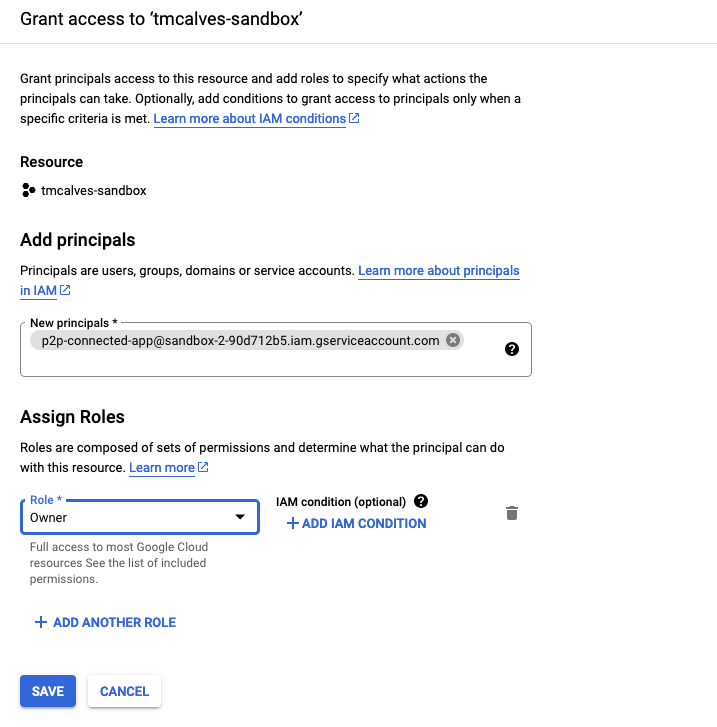
Validate that the p2p service account has enough permission on your own GCP project
The p2p service account needs permission to deploy the infrastructure.
The principal will be p2p-<tenantName>@<platformProjectId>.iam.gserviceaccount.com.
The role of Owner will allow it to create anything it needs, feel free to make this more restrictive.
Namespace Dashboard
Deploy gcloud-debug pod
Failure on the application
In order to determine whether the problem lies in the application code or is an issue with GCP permissions, you can
deploy a gcloud-debug pod to your tenant namespace. This pod can use the same service account as your application,
allowing you to perform operations directly using the gcloud CLI.
Create gcloud-debug pod
Example Kubernetes manifest file for gcloud-debug pod