This documentation guides platform users on accessing the CECG Kubernetes platform on Google Cloud Platform (GCP).
Prerequisites
Platform Readonly Group
The platform readonly group is used to specify which users in your organisation are authorised to generate a kubeconfig allowing them to execute kubectl commands against the cluster. This group DOES NOT authorise members to modify any resources in the cluster.
The group should be: platform-readonly@domain e.g. platform-readonly@cecg.io if your domain is cecg.io
GKE Security Group
We leverage GKE’s native support for using Google Groups to support RBAC within Core Platform clusters (see GKE Documentation). A requirement of this native support is a Google Group named gke-security-groups@domain to act as a top level group for nested team based groups.
This group should only contain other google groups as members, not users or service accounts (the user who creates the group will be an owner).
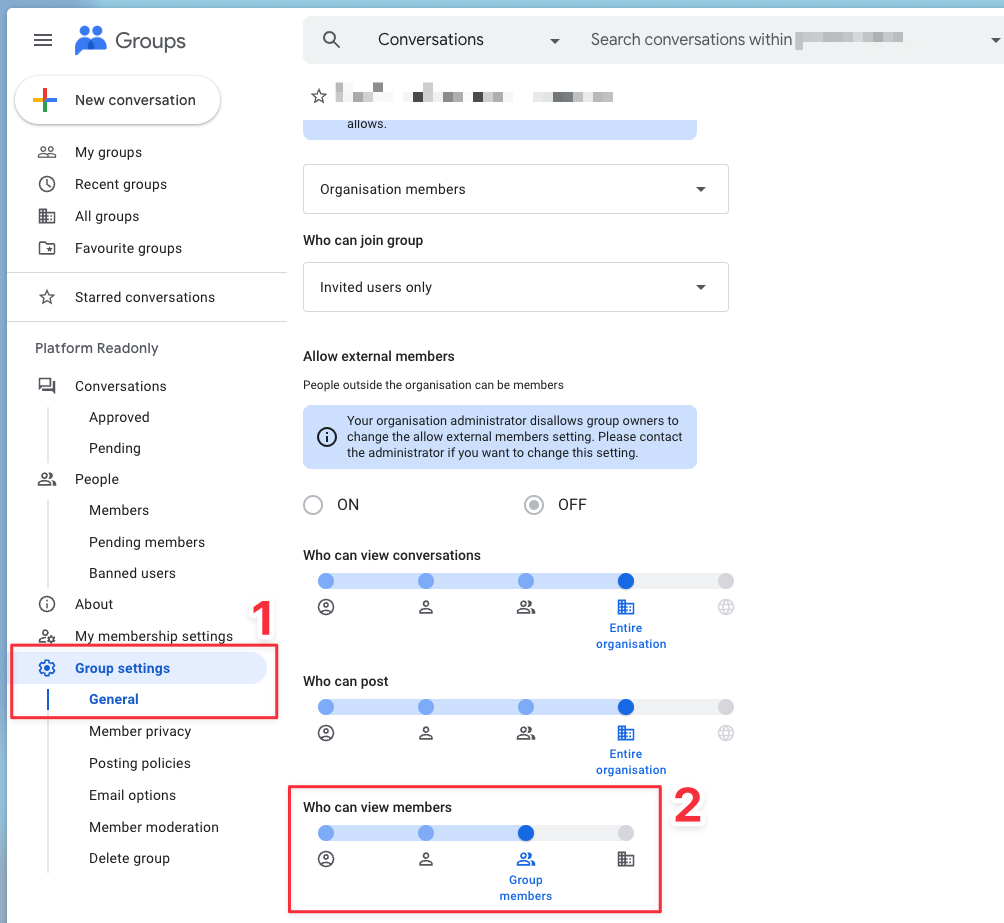
Group Member Visibility
The GKE + Google Groups native integration requires an additional configuration change to the gke-security-groups group. This group, and all nested groups within it must have their Group Settings -> Who can view members configuration set to Group members. As shown here:
# Install the gke-gcloud-auth-plugin binary (required)gcloud components install gke-gcloud-auth-plugin
# Update kubectl configurationgcloud container clusters get-credentials ${CLUSTER_NAME}\
--project ${PROJECT_ID}\
--region=${COMPUTE_REGION}# Update kubectl configuration to use the bastion as a proxykubectl config set clusters."$(kubectl config current-context)".proxy-url http://localhost:${LOCAL_PROXY_PORT}# Verify user access to resourceskubectl auth can-i get pods \
--namespace=${NAMESPACE}\
--as=${USER}@${DOMAIN}\
--as-group=${GROUP}@${DOMAIN}
💡 Tip: For a full example, check the Environments Repo.
GCP Registry Access
To access artifact registries, use the following command to configure Docker:
Now, you have read and write access to ${GCP_REGION}-docker.pkg.dev/${PROJECT_ID}/tenant.
Subsections of Platform Operations
Cluster Autoscaling
The platform supports running wide range of workloads while keeping its base cost low. It provides autoscaling capabilities to adjust the capacity of the cluster to handle flucations in traffic. When the traffic goes down, the cluster reduces to normal size.
By default, GCP applies 32 CPU quota per cluster. Autoscaling won’t be able to provision new nodes when quota is reached.
You may need to consider increasing the quota, so that you have enough resources to run your pods under peak loads.
Node Pools
Platform and tenant pods run on worker nodes which are governed by node pools.
By default, we create a small node pool that runs platform system pods.
This pool will not be enough to run tenant workloads, so additional node pools need to be created via auto-provisioning and/or configured explicitly.
For GCP we recommend using Node Auto-Provisioning mode, so that GKE facilitates node pool scaling.
In special cases we allow Platform Operators to configure their node pools explicitly. This can be useful for a hybrid mode when general purpose nodes are provisioned automatically and there are additional node pools with special machine types to support CPU intensive workloads.
This is a small pool (1 node per zone) with e2-standard-2 machine type.
By default, the platform system pods run there.
Assuming we are running a regional cluster with 3 zones, the minimal cost to operate the platform will be 3 nodes of e2-standard-2 machine type.
Scaling with Node Auto-Provisioning
Note
Enabling autoscaling will enforce 1 node to be present in the pool at all times to ensure system pods are running. If you wish to scale down node pools to 0, you have the option of disabling autoscaling. See limitations for more details.
Node Auto-Provisioning (NAP) is used to manage node pools. It allows us to support workloads with various CPU and memory requests by creating node pools with optimal machine types.
In order to enable Node Auto-Provisioning you should specify:
number of CPU cores for the whole cluster
number of gigabytes of memory for the whole cluster
BALANCED: The default profile for Standard clusters that prioritises keeping resources available for incoming pods.
OPTIMIZE_UTILIZATION: Prioritise optimizing utilization over keeping spare resources in the cluster. The cluster autoscaler scales down the cluster more aggressively. GKE can remove more nodes, and remove nodes faster.
The following examples enable Node Auto-Provisioning for the cluster via config.yaml:
By default, GCE quota is 32, we reserve a 2vCPU VM for the bastion, so that’s 30 cores left
This is discouraged, but available for users for which the default pool doesn’t work.
Node pools need:
machine type, e.g. e2-standard-4
range for the number of nodes in the pool.
optional taints and labels
Note
We cannot explicitly define max CPU or memory for the node, we can do it only by choosing the proper machine type.
GKE automatically creates new nodes in the pool until it reaches their maximum count.
When limit is reached newly deployed pods will stay in Pending state waiting for resources to become available.
In specific cases it is possible to combine NAP with explicit node pools configuration. For example,
we may need machines with special capabilities. While having common workloads scheduled on auto-provisioned nodes,
we may have custom node pools that are managed explicitly.
The following is an example of a hybrid configuration providing a node pool with special capabilities:
When tenants provision more replicas they may experience long delays between deploying a new Pod and actually running it. Provisioning of a new node takes time, it can be up to several minutes. This may not be an issue for a background job, but can definitely affect the performance of an API
that needs to scale quickly to be able to handle traffic spikes.
Solution
Overprovisioning
Can be configured using deployment running pause pods with very low assigned priority (see Priority Preemption) which keeps resources that can be used by other pods.
If there is not enough resources then pause pods are preempted and new pods take their place.
Next pause pods become unschedulable and force CA to scale up the cluster.
Before Ingress can function, you must delegate the configured zone to the Google nameservers.
These nameservers are not fixed, and can be seen after deployment of platform Ingress with the following command:
kubectl -n platform-ingress get dnsmanagedzones.dns.cnrm.cloud.google.com -o=jsonpath='{.items[0].status.nameServers}'
When your Core Platform is initially deployed it comes with a zone under CECG’s domain, including your organisation’s <name>.
This is just to aid the initial developer experience and isn’t intended for your production services.
The domains follow this structure:
<name>.platform.cecg.io
<env>.<name>.platform.cecg.io
<name> the name of the set of environments. Each set of environment typically is made up of pre-dev, dev, prod.
<env> is the environment name within a Core Platform.
For example, we (cecg) run our own instance of the core platform with a name of cecg so we will end up with:
sandbox.cecg.platform.cecg.io
pre-dev.cecg.platform.cecg.io
dev.cecg.platform.cecg.io
prod.cecg.platform.cecg.io
The cecg.platform.cecg.io is not currently managed so the user of the Core Platform needs
to create and delegate every env’s zone.
Managed Databases
Benefits
Easy setup
Integration with existing Cloud Security methods (IAM Auth etc)
Less human resources involved in setting them up
Downtime SLA’s provided
Easily configurable HA and scalability
Automatic upgrades
Out of the box backups
Out of the box data encryption, which is a requirement for things like PCI
Disadvantages
Vendor locked
Less configurable compared to self hosted
Higher running cost
Managing Platform Environments
Environments
The platform by default comes with a single organisation made up of three environments:
pre-dev: Stage new versions of the platform before releasing to application engineers
dev: Used for all development environments, functional testing, integrated testing, performance testing
prod: Production
Gcp init
The gcp-init tool comes bundled inside the platform docker image. From inside the image:
cd gcp-init
source .venv/bin/activiate
python gcp-init.py --help
Creating an organisation
It is expected to have a single organisation, meaning one set of environments.
Before execute core-platform-cli we use any of the commands, we need to generate some Application Default Credentials (ADC):
This will generate JSON credentials for your user account, and move them to a file called Platform-user.json in the gcloud config directory. We’ll use this file to authenticate as your user when running certain commands.
Before running root-init, we need to check some GCP permissions. Before we can initialize a “parent” (a GCP org or folder), we need the following:
roles/viewer on the parent
roles/resourcemanager.folderCreator on the parent
roles/resourcemanager.projectCreator on the parent
We can now run the root-init command from within the core-platform-cli:
PARENT_FOLDER=??? # e.g. folders/12345BILLING_ACCOUNT=??? # e.g. 01BC90-344AF2-CED391ENV_REPO=??? # e.g. e.g. {{ github-org }}/platform-environmentsPLATFORM_ADMIN_GROUP=???
GOOGLE_APPLICATION_CREDENTIALS=$HOME/.config/gcloud/Platform-user.json \
python gcp-init.py root-init \
--parent=$PARENT_FOLDER \
--billing-account=$BILLING_ACCOUNT \
--github-repos=$ENV_REPO \
--impersonators=group:$PLATFORM_ADMIN_GROUP \
--owners=group:$PLATFORM_ADMIN_GROUP
This script is idempotent, if you encounter Cloud API failures, you can generally re-run the command and it will only create the missing resources.
Warning
If the errors are that your user doesn’t have permissions to do something, that probably won’t be fixed by re-running
Creating an environment
To be able to run the next step command (gcp-init.py env-init ...) we need to generate some new application credentials, allowing us to impersonate the env-manager service account from the previous step:
This will generate JSON credentials for the service account, and move them to a file called Platform-env-manager.json in the gcloud config directory. We’ll use this file to authenticate as the SA when running certain commands.
We can now extract some information from output-root_init.json to use as input to the env-init command:
This will attempt to initialize an environment called dev, as before, the script is idempotent and can generally be re-ran in the face of errors until it has completed.
![WARNING]
If the errors are that your SA doesn’t have permissions to do something, that probably won’t be fixed by re-running
Manual Steps
Brand
The IAP Brand needs to be manually created before deploying the Core Platform.
After running the environment creation. Get the project id under the new environments folder
then run:
The platform allows you to optimise your infrastructure for maximum cost efficiency. There may be situations where you are running workloads where availability is not a priority e.g. lower environments.
Run workloads while keeping its base cost low using spot capabilities offering 60-91% discount compared to standard virtual machines (VMs)
Note
Default node pools hosting system pods run on standard VMs.
Spot Instances
These instances work by using Compute Engine (CE) excess capacity. When CE needs to use some of that capacity for example during zonal outages, it will shut down those instances to free up capacity.
Platform monitoring is responsible for ensuring the quality of the platform by providing visibility on the health of
the platform and workloads running on it.
It allows both platform operators and application teams answer two basic questions: what’s broken and why?
By collecting metrics from key platform components such as control plane, data plane, bastion and tenants workloads,
platform monitoring allows operators and application teams to:
analyse long-term trends (e.g. how quickly is my database growing)
compare impact of feature releases
notify when something is broken or might break soon
help answer basic questions about the health of the system using dashboards
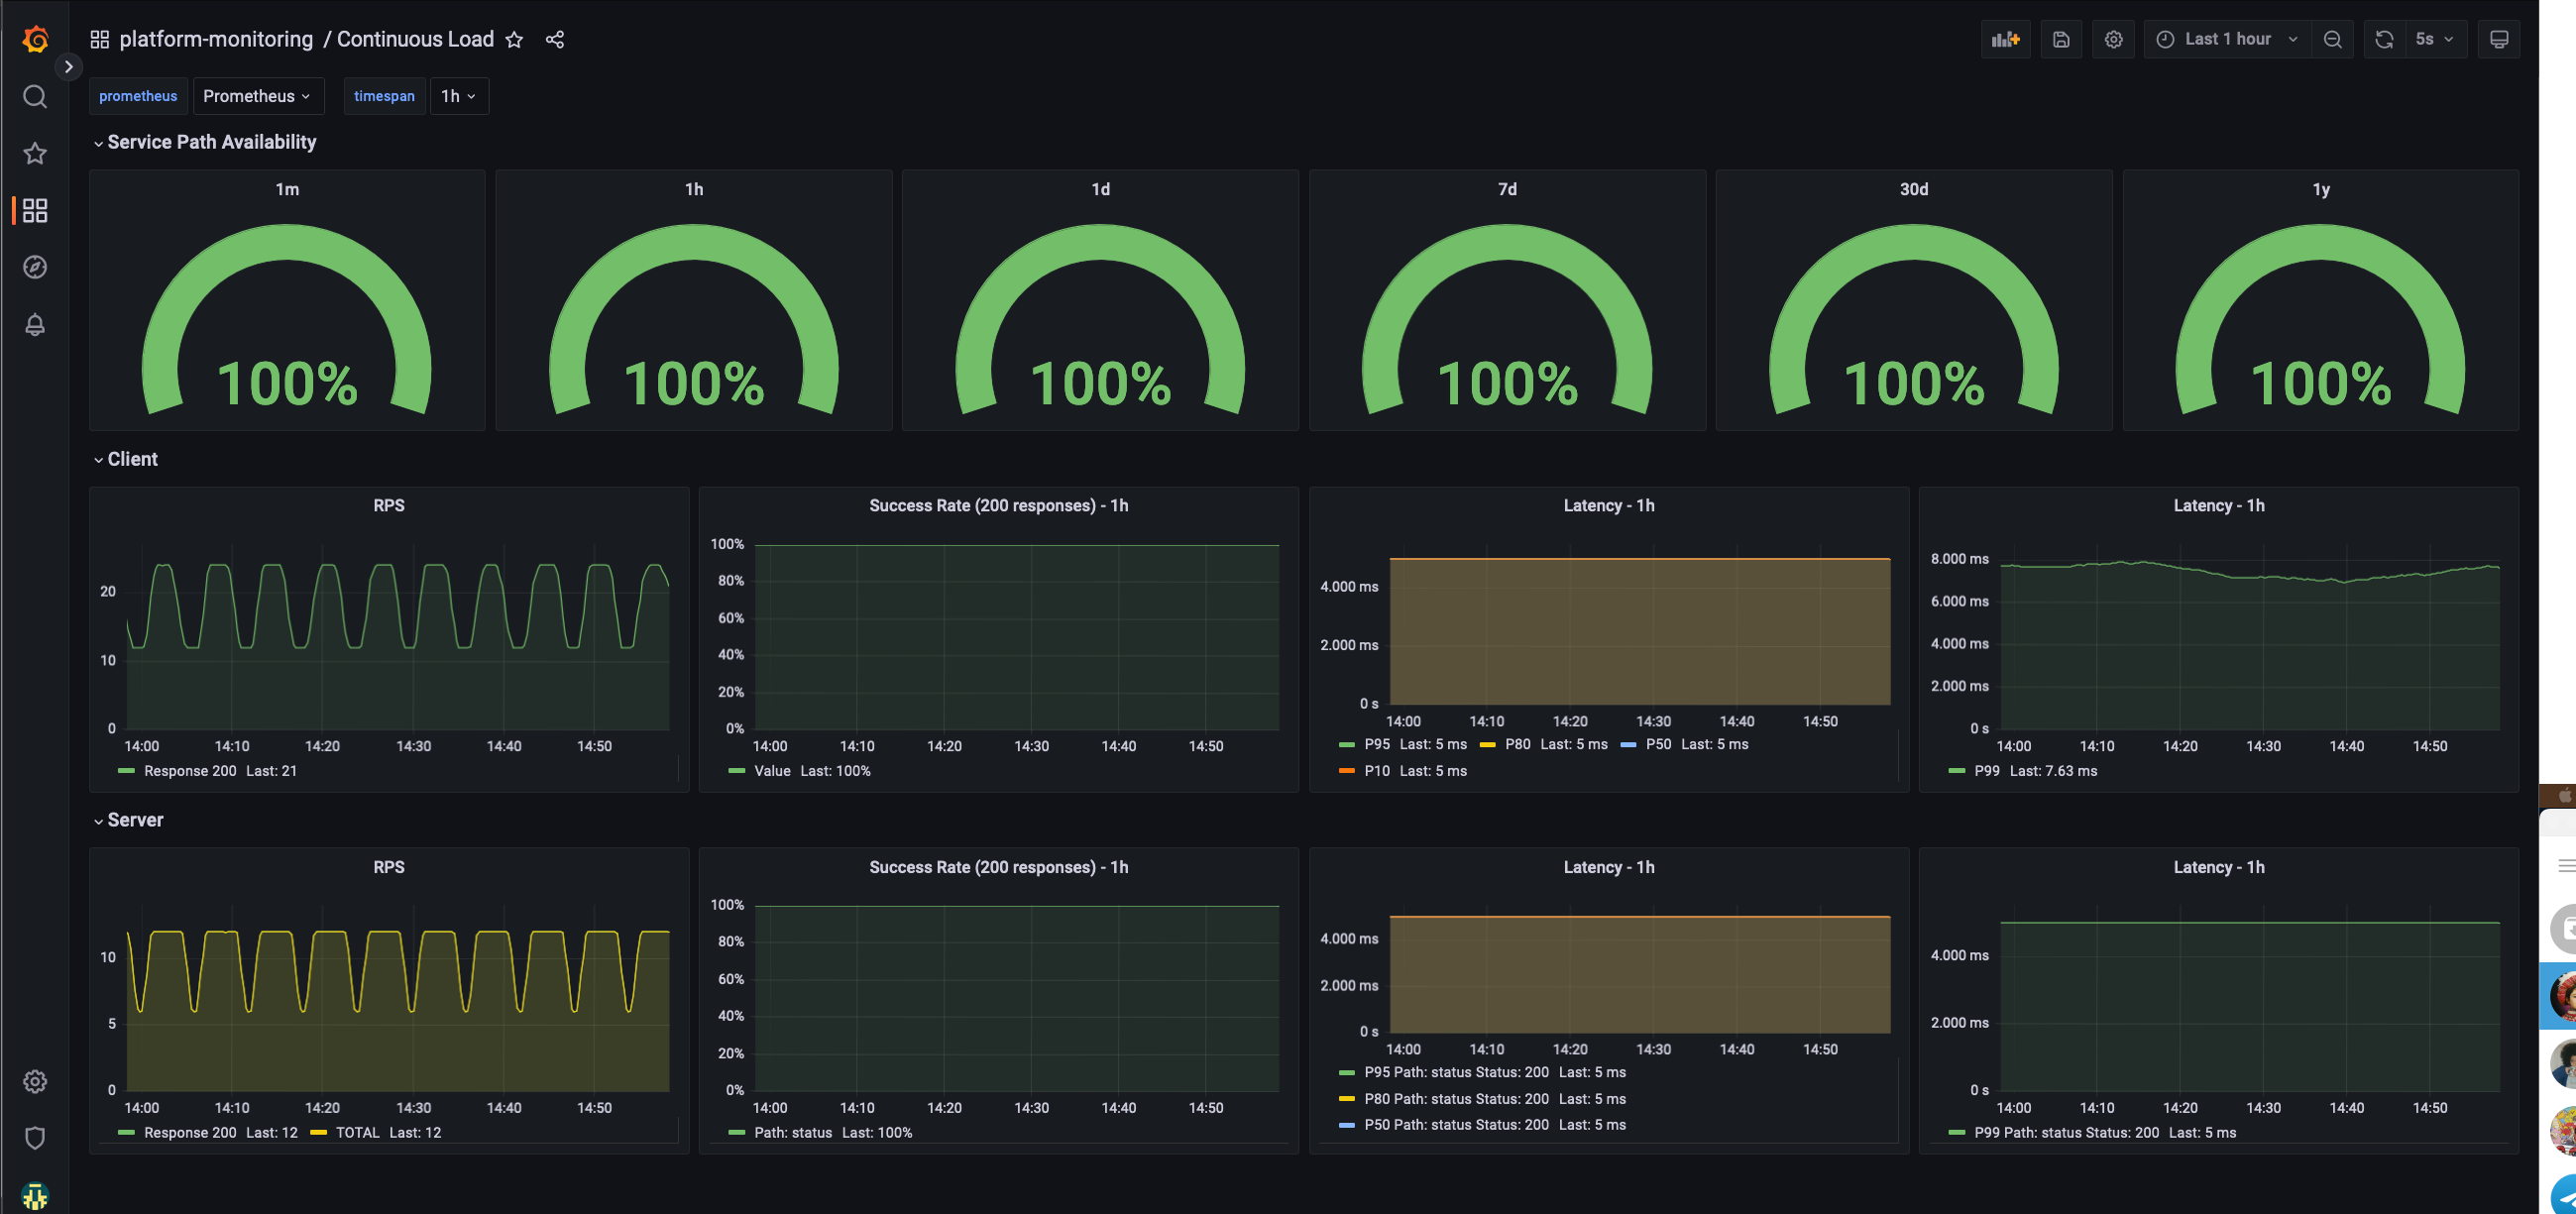
Platform Uptime
Uptime is measured by traffic sent continuously to an application deployed as part of the platform.
To view uptime for each environment you can use Continuous Load Grafana dashboard. For quick access it, run:
corectl env open <env> grafana/continuous-load
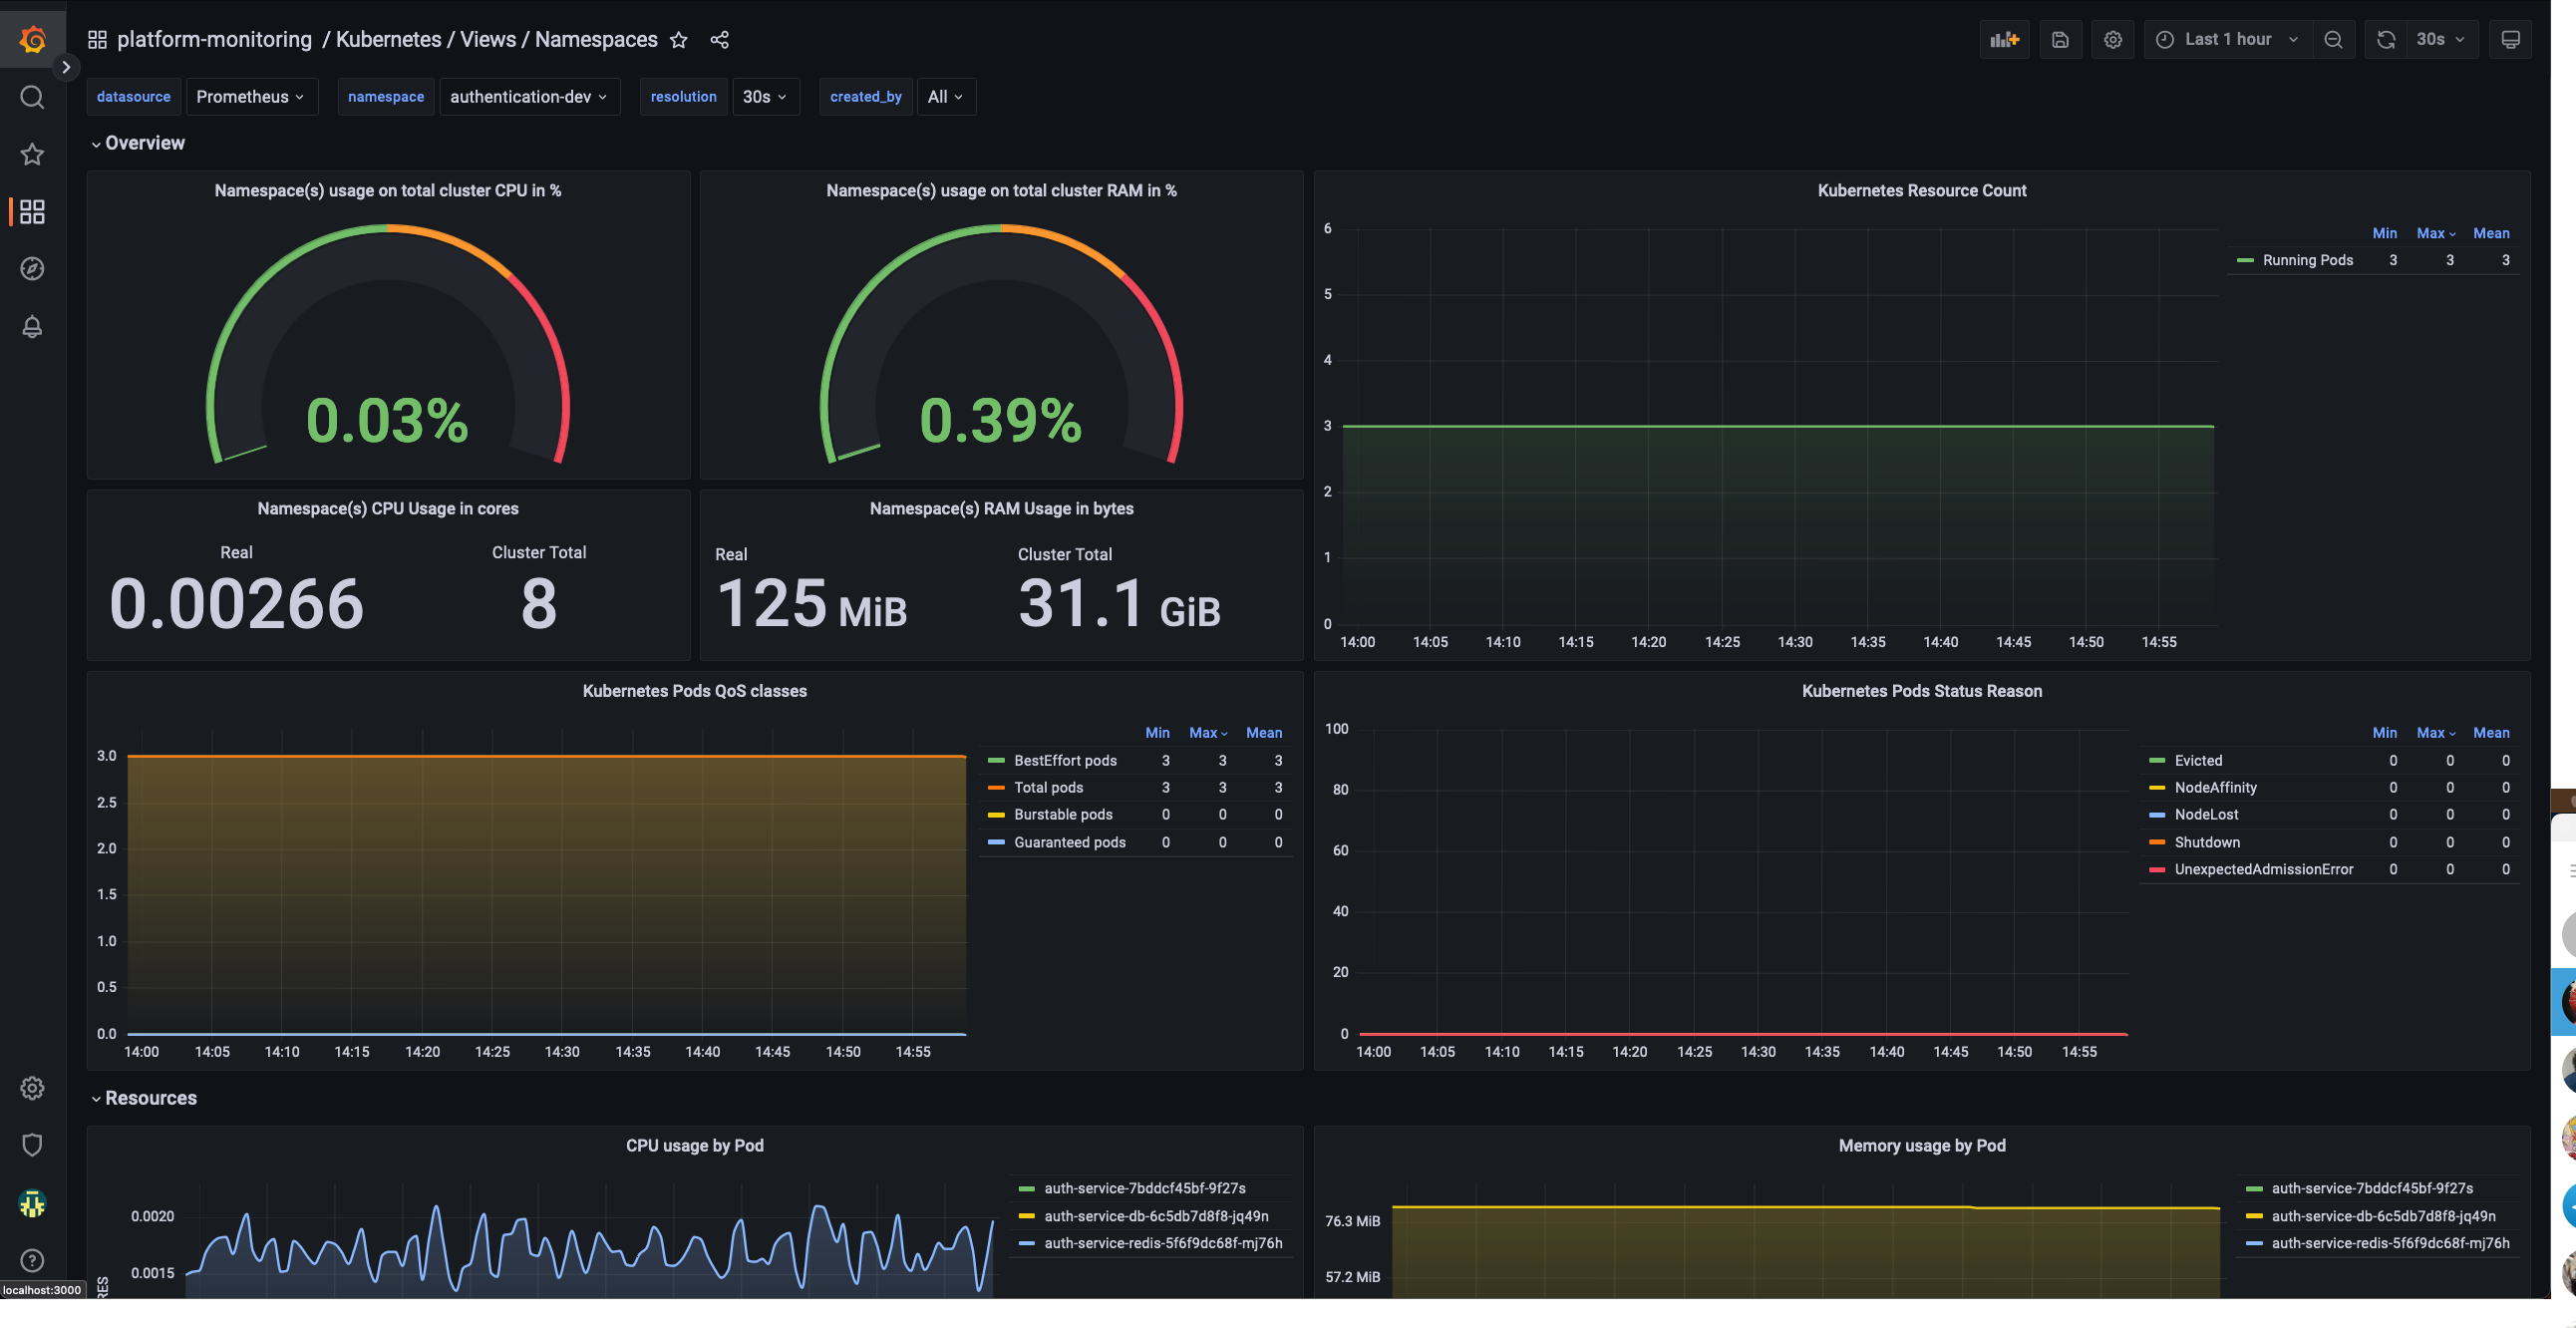
Application resource monitoring
This dashboard allows a tenant to monitor their namespaces. It shows:
CPU Usage
Memory usage
Pod status
Pod restart count
Namespace Dashboard
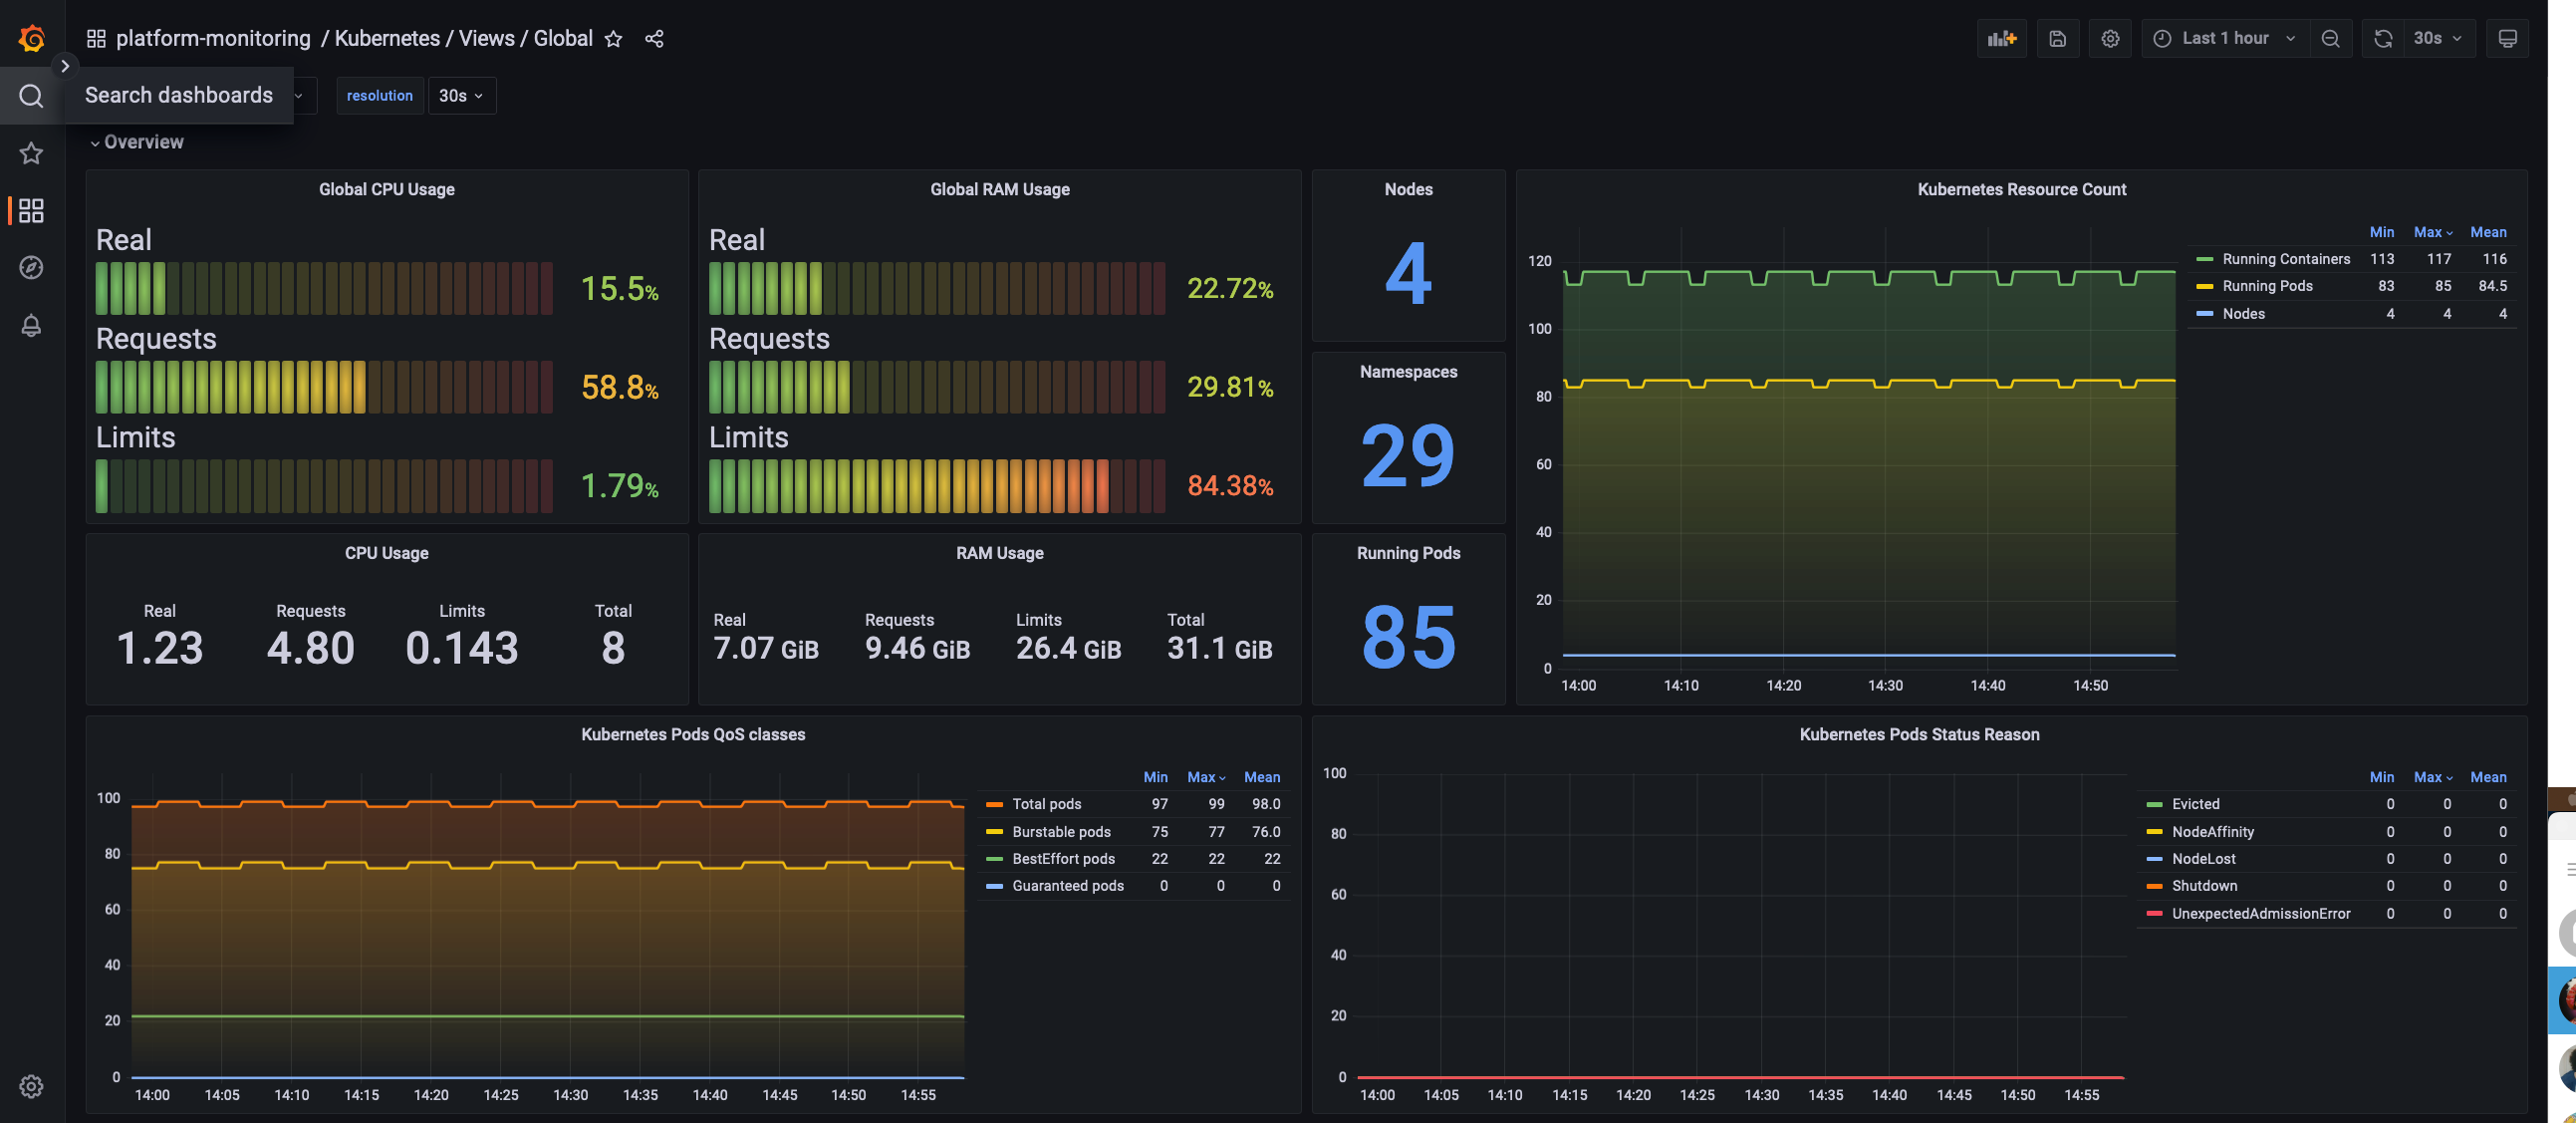
Cluster wide resource monitoring
Global view dashboard gives holistic view of the cluster.
It shows:
Nodes status
CPU and Memory usage, requests and limits
Pod and namespace count
Pods status
Global Dashboard
Cluster connectivity monitoring
The platform-monitoring module also deploys continuous load.
This will create k6 injectors and pods with podinfo, always with a stable throughput allowing us to monitor with enough data the different percentiles and any errors that occur to ensure that we can be proactive in investigating and fixing any issues.
Continuous load Dashboard
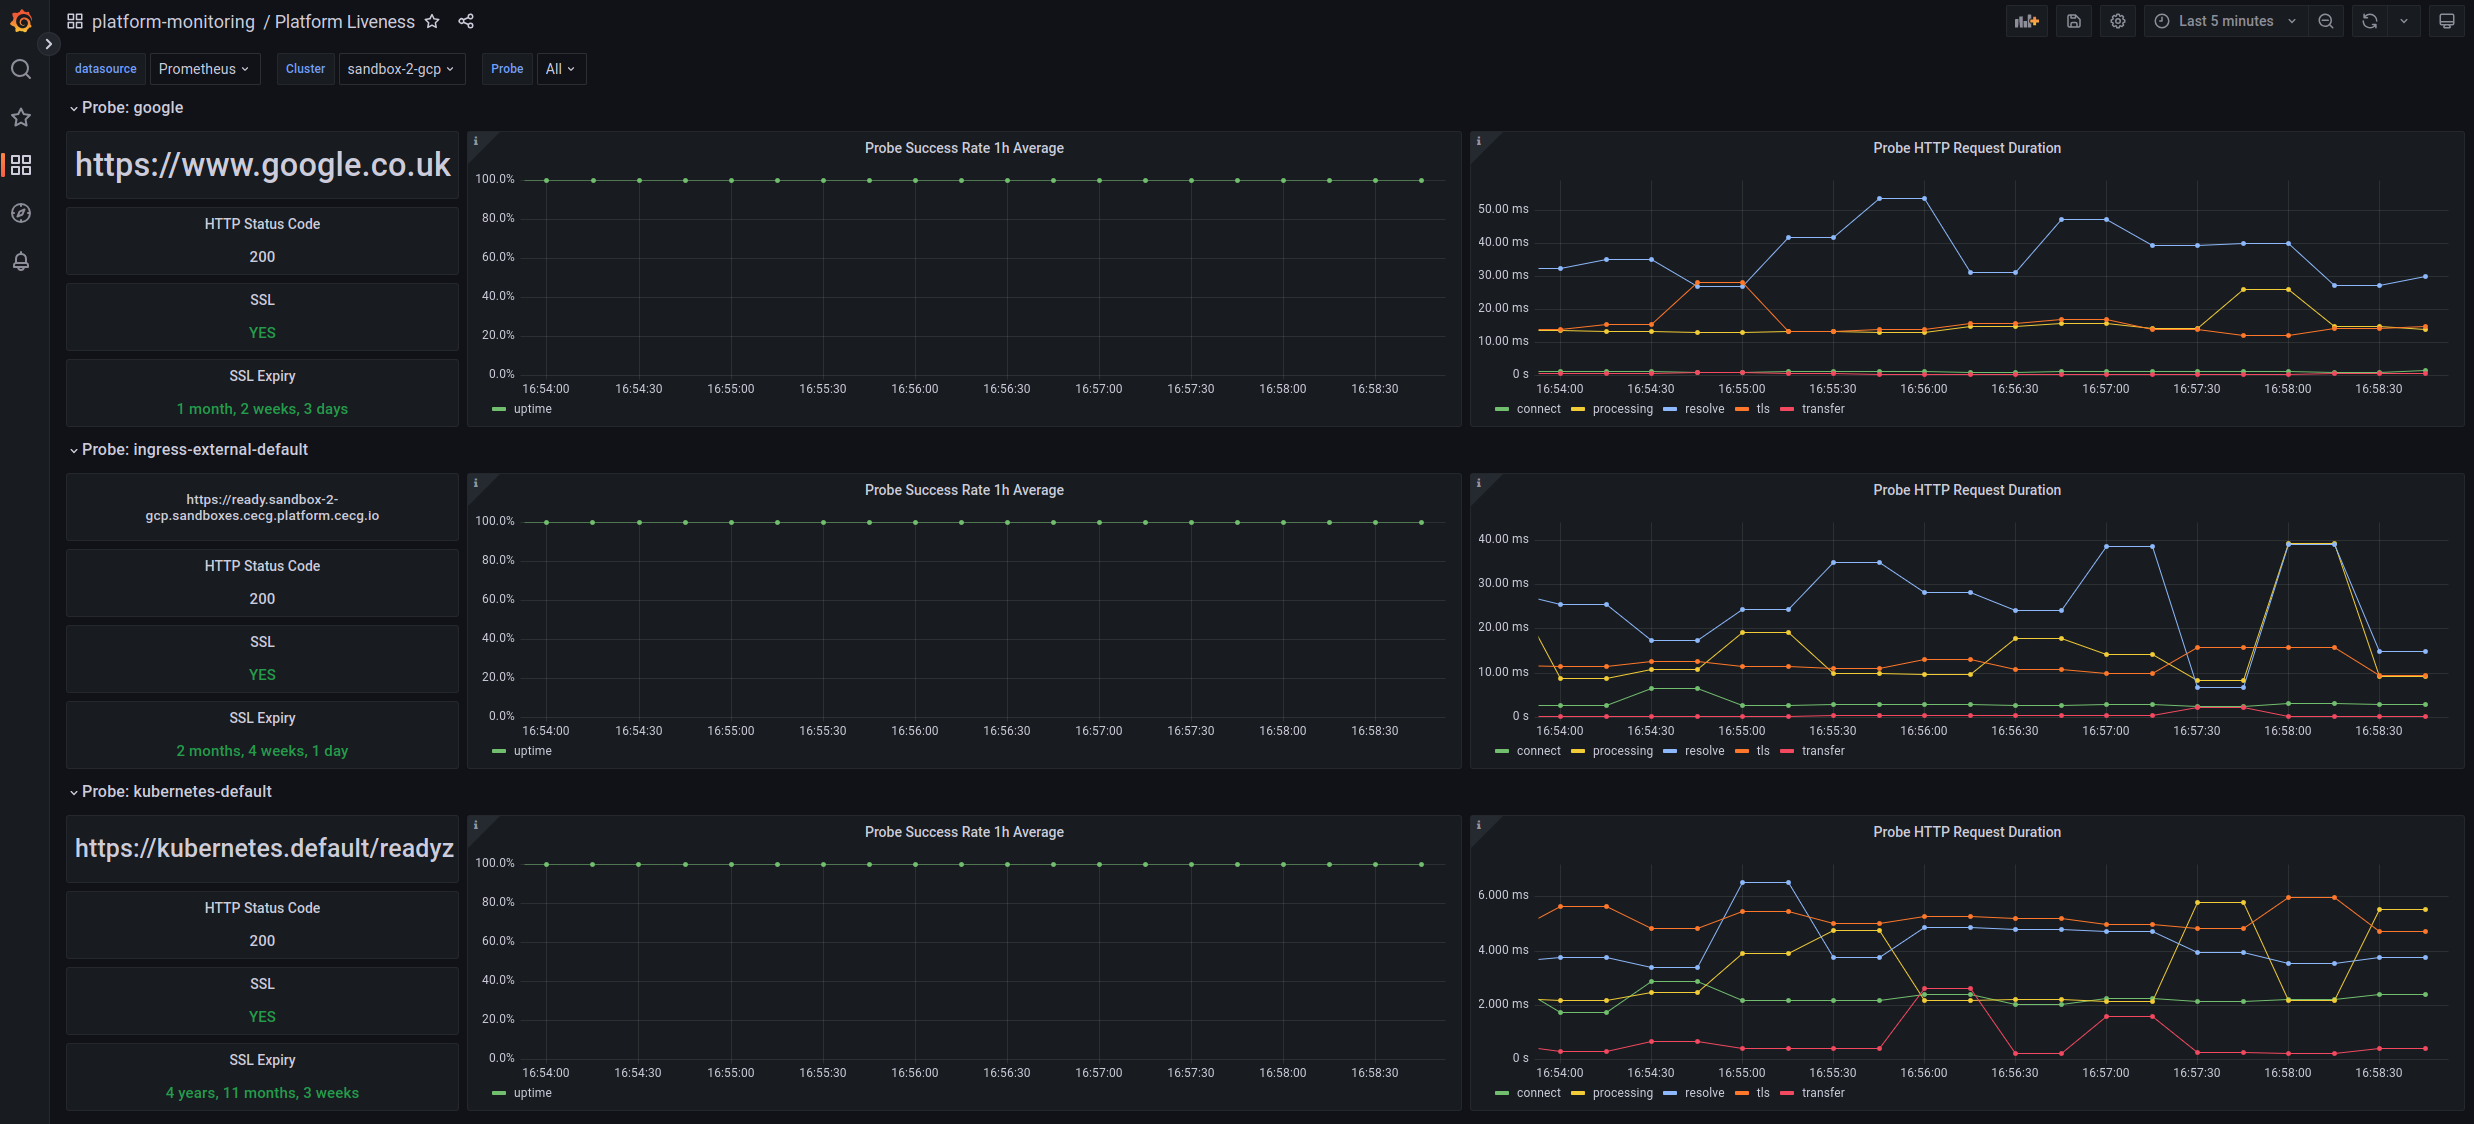
Platform liveness
Shows uptime and probe success rate and duration of key endpoints we monitor on the platform.
It can also be used to check SSL expiry.
Platform liveness
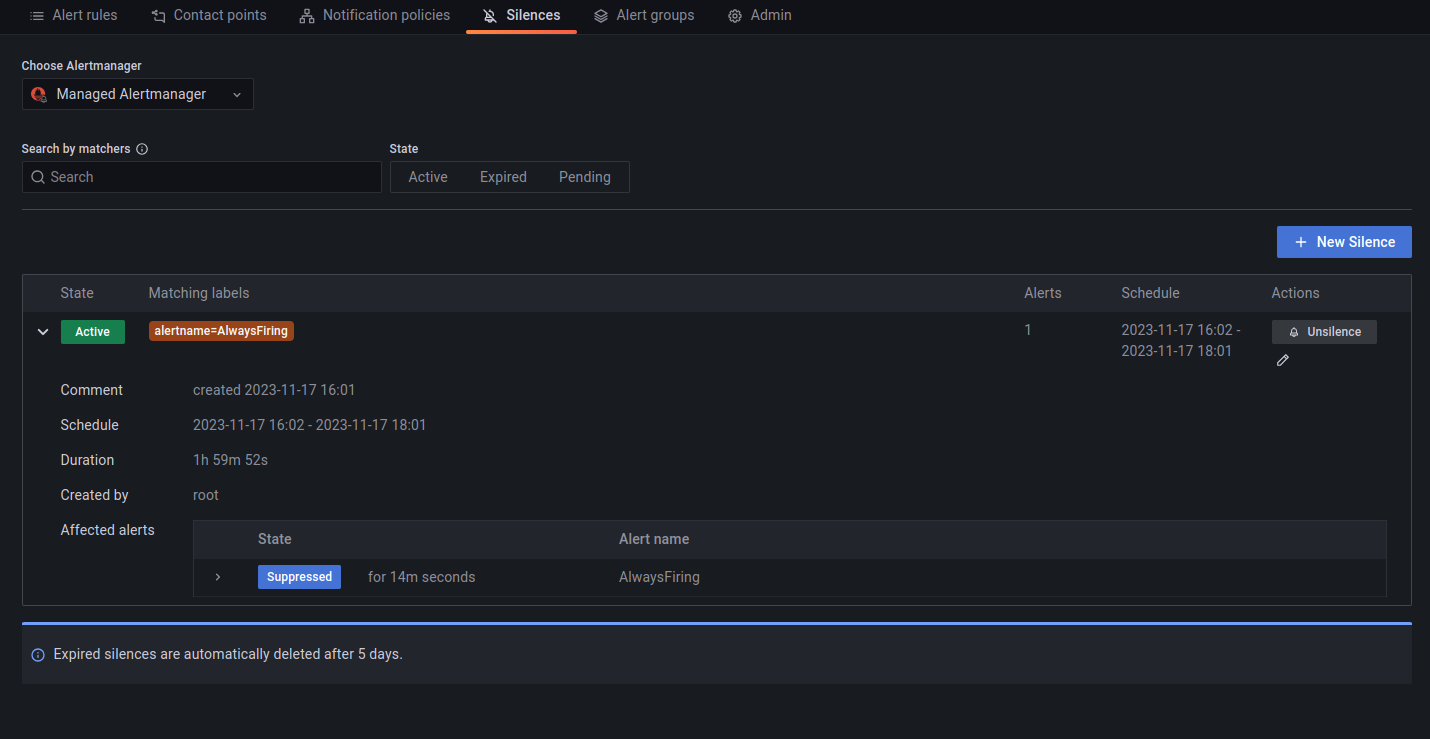
Platform alerts
Firing and silenced alerts
Firing alerts can be viewed in the Grafana UI either via the Alerts dashboard or via the built-in Alerting section.
Alerts can be silenced via the Alerting section by matching the alert(s) label that needs silencing.
Alert silencing
Outbound Connections
Outbound Connections
Cloud NAT (network address translation) lets certain resources in GCP create outbound connections to the
internet or to other Virtual Private Cloud (VPC) networks, on-premises networks, or other cloud provider networks. Cloud
NAT supports address translation for established inbound response packets only. It does not allow unsolicited inbound
connections.
Outbound IP
By default, GCP allocates IP addresses automatically. The IP addresses are managed by GCP, added or removed based on the
outbound traffic. This is the default platform configuration. With automatic allocation, you cannot predict the next IP
address that is allocated. If you depend on knowing the set of possible NAT IP addresses ahead of time (for example, to
create an allowlist), you should use manual NAT IP address assignment instead.
Static (Manual) Outbound IPs Assignment
The platform provides a feature that enables allocation of a number of static IP addresses that can be reserved upfront.
When using that feature, you must calculate the number of regional external IP addresses that you need for the
NAT gateway. If your gateway runs out of NAT IP addresses, it drops packets. You can increase or decrease the
number of allocated static IP addresses by updating platform environment configuration. Those IP addresses are reserved
and will remain so until you delete them. To enable this feature, we
use Manual NAT IP address assignment with dynamic port allocation
Platform environment configuration
network:
publicNatGateway: # [Optional] configuration for the NAT GatewayipCount: 2# [Required] number of IP addresses to allocatelogging: ERRORS_ONLY # [Optional] enable logging, available values: ERRORS_ONLY,TRANSLATIONS_ONLY,ALL, when not provided no logging is enabled, we recommend setting to ERRORS_ONLYminPortsPerVm: 64# [Optional] min number of ports per VM, when not provided default (64) is usedmaxPortsPerVm: 128# [Optional] max number of port per VM, when not provided default (32,768) is usedtcpEstablishedIdleTimeoutSec: 1200# [Optional] timeout (in seconds) for TCP established connections (default 1200), only update when necessary, otherwise leave defaulttcpTransitoryIdleTimeoutSec: 30# [Optional] timeout (in seconds) for TCP transitory connections (default 30), only update when necessary, otherwise leave defaulttcpTimeWaitTimeoutSec: 120# [Optional] timeout (in seconds) for TCP connections that are in TIME_WAIT state (default 120), only update when necessary, otherwise leave default
Recommended overrides
network:
publicNatGateway: # [Optional] configuration for the NAT GatewayipCount: <numbers of IPs to allocate>logging: ERRORS_ONLY# enable logging for packet drops due to NAT IP allocationminPortsPerVm: <set min number of ports per VM>maxPortsPerVm: <set max number of ports per VM>
Allocating more IP addresses might cause source IP changes to existing services for outbound requests. If third party
clients allowlisted specific IPs, they’ll need to update their allowlist accordingly.
Calculate the number of IPs required. To understand your current NAT Gateway usage,
see NAT Gateway dashboard in Grafana.
For example of IP/ports calculations,
see Port reservation example. To
define min number of ports per VM,
see Choose a minimum number of ports per VM
Cloud NAT gateway will dynamically allocate different number of ports per VM, based on the VM’s usage. Min and max
ports settings are optional; however, it is strongly recommended to set those values to ensure strong tenant
isolation (misbehaving services won’t acquire all available connections). For more information on port allocation
see Ports section.
Note
Please note that NAT Gateway has GCP imposed limits, see NAT limits for
details.
Decrease allocated number of IP addresses
Warning
Increasing the number of IPs is a safe operation; the existing connections won’t be affected, however, decreasing the
value without draining the connections first will cause connection being terminated immediately.
See Impact of tuning NAT configurations on existing NAT connections
for further details.
All IP addresses are created sequentially, following naming convention <env>-nat-ext-ip-<number>, numbered from 0 to
X. During IP address reservation the platform stores those IPs in an ordered list. We recommend that you remove one IP
address at a time. Decreasing network.publicNatGateway.ipCount number by one causes removal of a last IP address in GCP,
therefore make sure you drain last IP address. In case you remove/drain the wrong address, the release fails as you
cannot delete addresses that are still allocated to NAT Gateway.
Ensure you’ll choose the last created IP address; this is the address with the greatest number, following naming
convention <env>-nat-ext-ip-<number>
A Platform environment is the underlying infrastructure for Application environments. It scales up and down automatically based on the applications deployed to it. Dev and prod are isolated to reduce the blast radius of platform deployments.
Each platform environment has a set of predefined workflows that will be executed to test, validate, and publish the application. These workflows ensure the stability and reliability of deployments across different stages.
Choosing a Platform Environment
When setting up a new tenant, you will be prompted to choose a platform environment eg:
Pre-Development (pre-dev) should only be used by platform operators for validating new versions of the environment. Most developers can ignore this option.
Development (dev) should be used for frequent testing and experimentation.
Production (prod) should only be used for live applications with end-user interactions.
Platform Ingress
Platform Ingress
Platform Ingress is responsible for creating the Ingress setup.
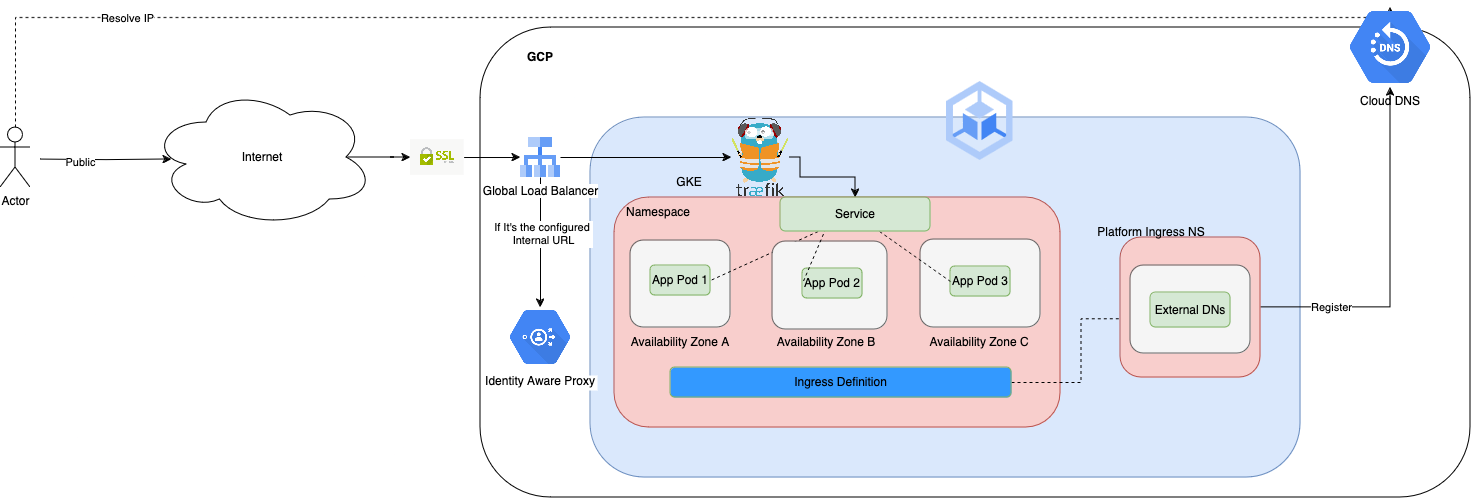
Design
Ingress design
What does it include?
Public and Private access
Cloud DNS managed zones to manage the DNS
External DNS
Traefik Ingress controller
How does DNS work?
Out of the box we will provide a subdomain of cecg.io. If they have their own domain, that can be configured based on the config.yaml. The base construction will be:
<environment>.<organization>.<ingressDomain>, for example, sandbox-gcp.cecg.cecg.io. The private URL construction will be configurable on the environment config file, but we typically keep the same one with an internal suffix, like sandbox-gcp-internal.cecg.cecg.io
The platform-ingress module install a Gateway object that creates a GCP load balancer. External DNS picks that up and registers them with A records with the LB IP. All other domains are registered as CNAME records pointing to the A records.
If they use our cecg.io domain, there is an additional step that needs to be done for DNS Delegation. Since we own the domain, when trying to resolve anytihing ‘*.cecg.io` it will hit our DNS managed zones. We can however delegate the resolution of certain subdomains to specific. See DNS.
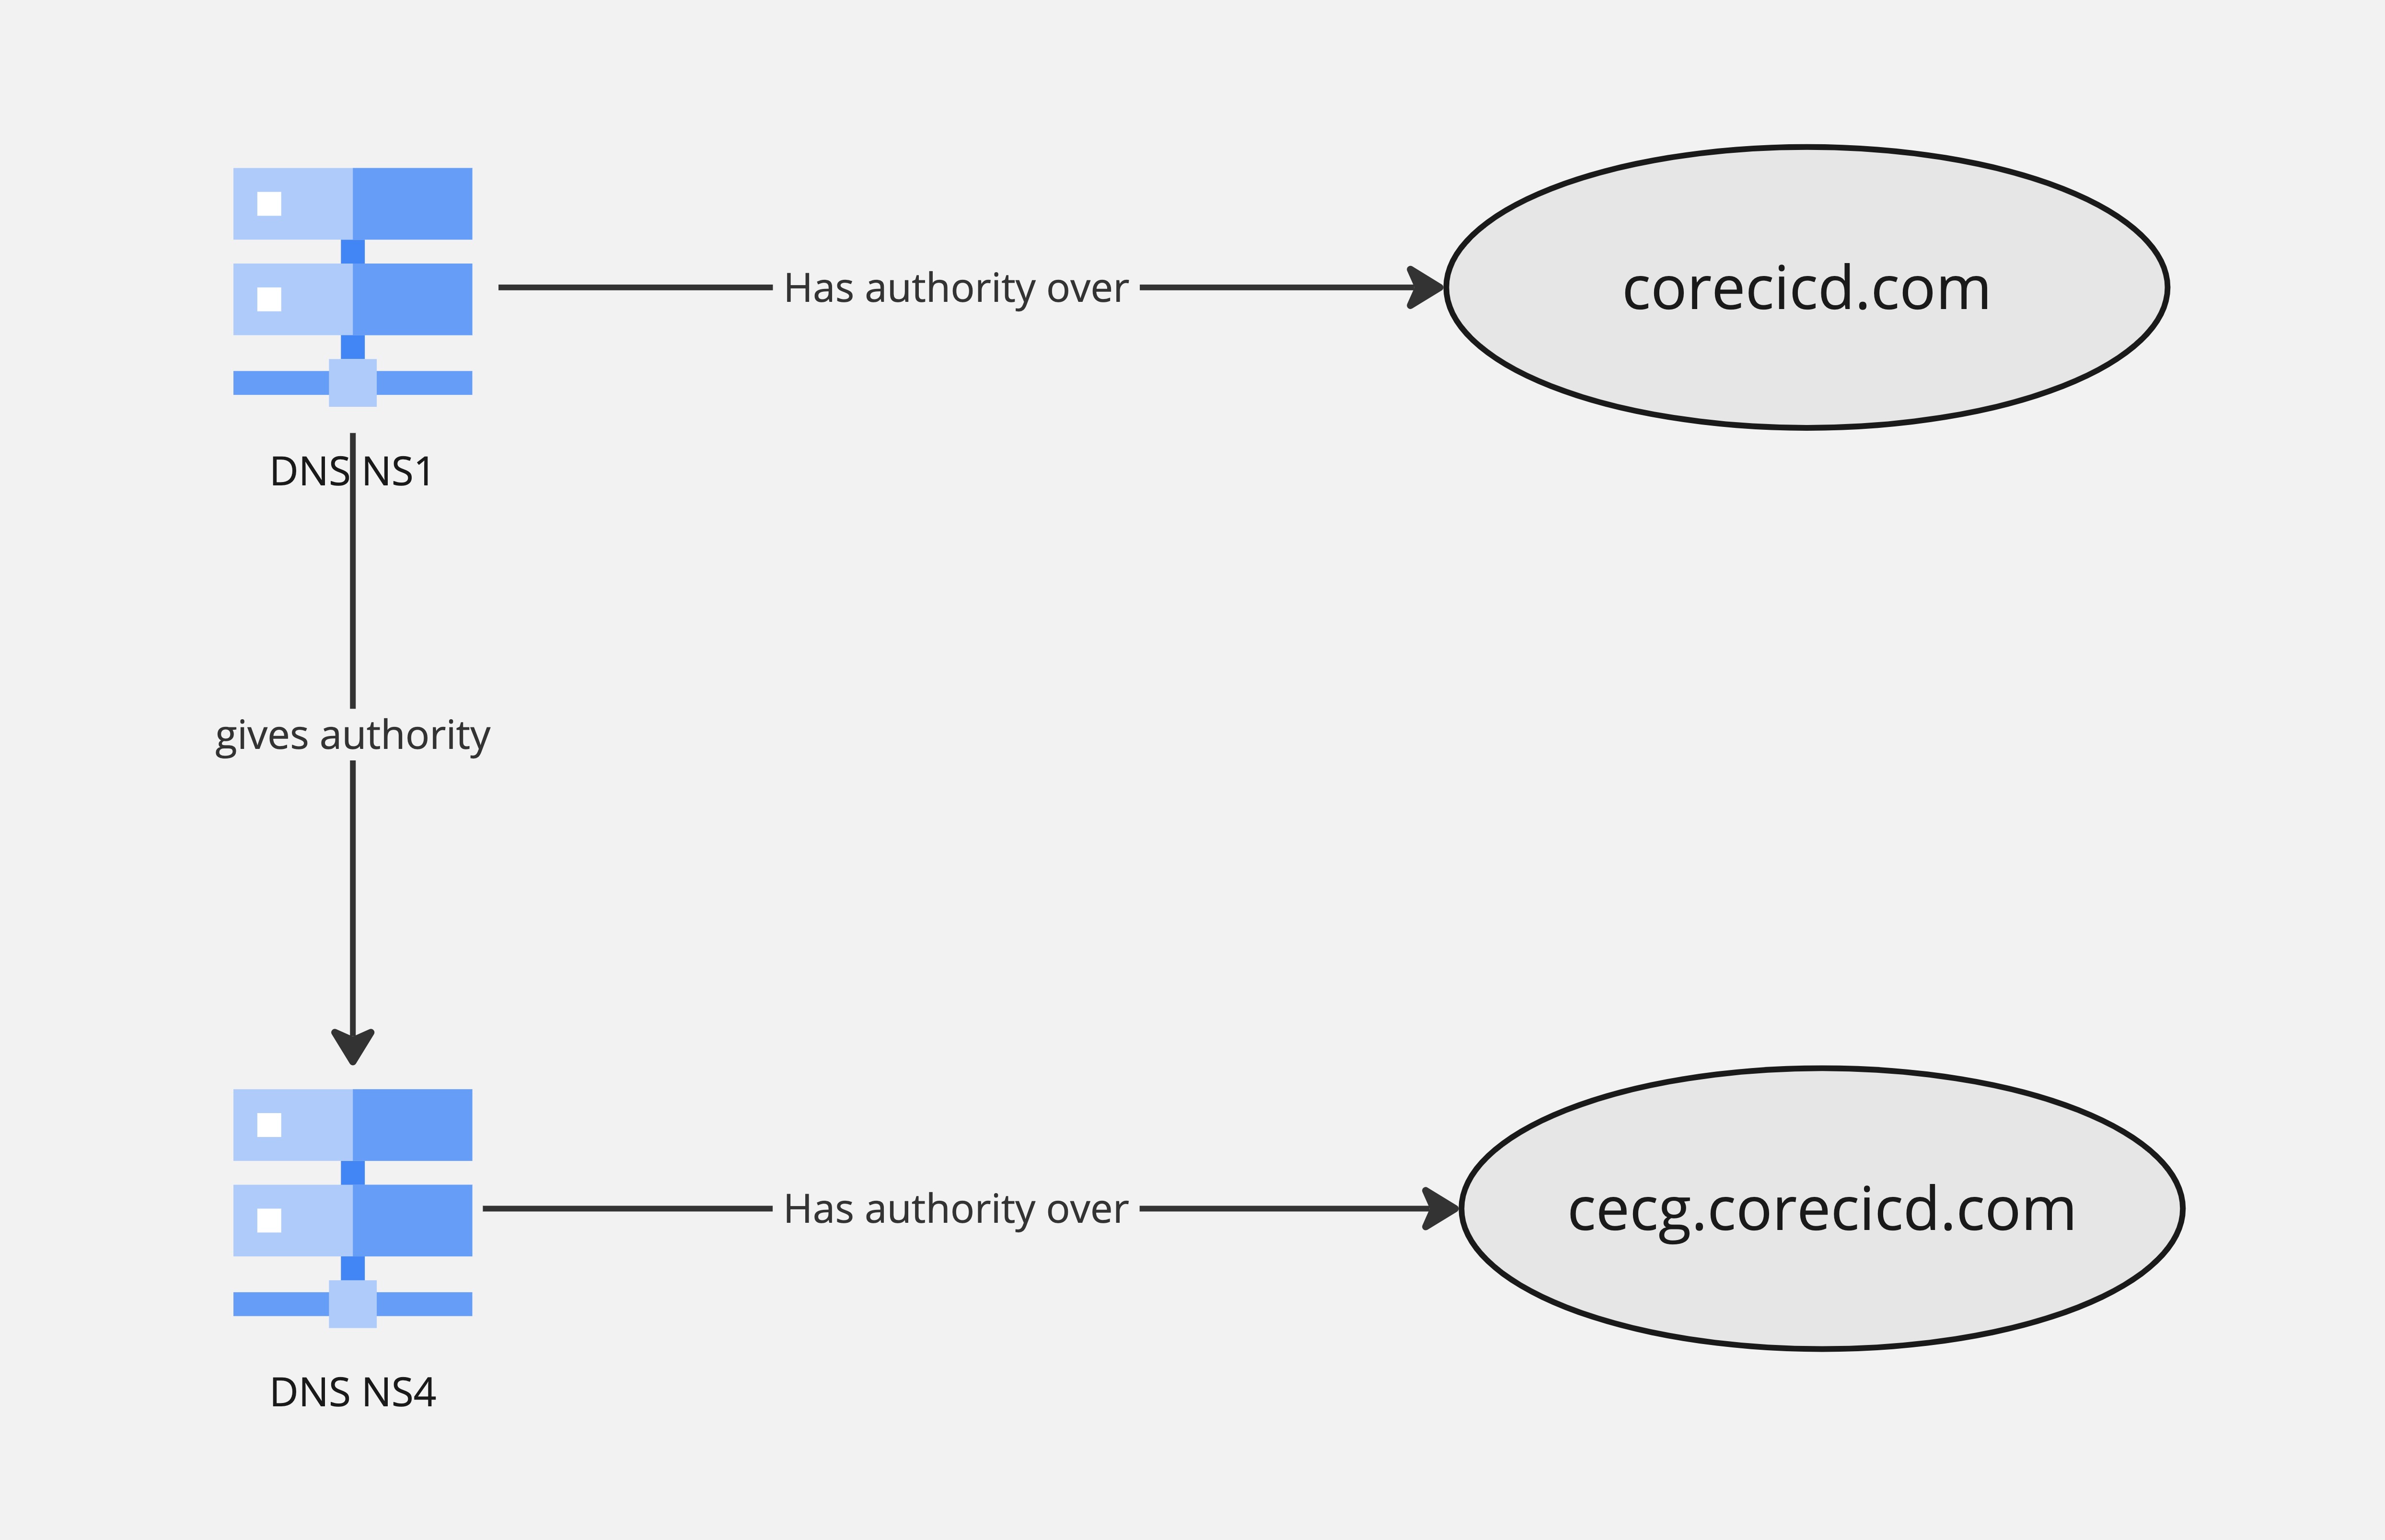
DNS delegation
How can clients manage records on a subdomain they do not own? We need to create a DNS delegation.
For cecg for example, we’ll need to delegate that subdomain to cecg client.
To do that, all you need to do is to create a NS record with the nameservers on the managed zone the cecg client created.
DNS Delegation
How can I differentiate between internal and external
There is a single ingress controller and load balancer. The way to differentiate is to use the ingress you configure in the environments config.yaml as internalService, for example sandbox-gcp-internal.cecg.cecg.io. Anything that hits that URL will be forward to the IAP for authentication and validations. Only people in the platform-readonly@<domain> google groups will be able to access that URL.
This means that everything is public because we do not use VPNs to access the cluster and always go through a public LB, but we can restrict the access using IAP.
For external DNS to work, each ingress will need to have the annotations
This will work out of the box until the LB using Let’s Encrypt. It uses a single level certificate (eg. *.sandbox-gcp.cecg.cecg.io) which will allow users to create single level subdomain like learn-functional.sandbox-gcp.cecg.cecg.io. Any more levels won’t work unfortunately.
The following example overrides resource requests for Traefik pods, sets a range for the number of replicas
and overrides the CPU usage percentage threshold.
We aim to be tech agnostic and remove some redundancies, namely regarding external-dns annotations. For that we will create a mutating webhook that will inject the needed annotations based on the URL of the ingress. It will also check for conflicts in the configuration and block the creation of any already existing as that will cause the IC to load balance between 2 possibly completely distinct application
Control Plane and Node Upgrades
Background on GKE versions
In GKE, you cannot specify an exact control plane Kubernetes version. You also cannot downgrade what’s currently
deployed. What you can do though, is set the minimum kubernetes version you want applied to your cluster.
The versions you get are influenced by Release Channels. Being subscribed to a Release Channel is generally considered a good practice for most,
and the Release Channel you are subscribed to dictates the versions that you have available.
For further information on this subject, take a look at this in depth documentation.
Without going into too much depth, there are currently 3 Release Channels:
RAPID
This channel delivers the absolute latest features, but with the caveat that these features may not be fully proven in
production environments. It’s ideal for staying on the bleeding edge but comes with potential risks.
REGULAR
This is the default option and strikes a balance between providing new features and ensuring stability.
Upgrades happen every few weeks, giving you access to new features without being the first adopter.
STABLE
This channel prioritizes stability and only receives the most well-tested updates. Upgrades occur less frequently than
the Regular channel, making it suitable for production workloads requiring maximum uptime and reliability
Not subscribing to a release channel
As mentioned above, if you do not explicitly define your release channel, it will default to REGULAR. What you can do
though is explicitly define the release channel to either null or unspecified, at which point you will not be subscribed to any release channel.
GKE will still upgrade your clusters on a scheduled basis, usually move them on to the next minor version, and apply security patches.
There’s various pros and cons to not being subscribed, but some key points are:
Benefits
More control over the timing of your upgrades
Can stay on a specific Kubernetes version for a longer time
Drawbacks
Manual management is required, you will have to keep an eye out for newer Kubernetes versions and security patches and apply those yourself
Some security risks are also involved as if you don’t update in a timely manner your cluster might become vulnerable to security exploits.
Our Channel
We are currently subscribed to the REGULAR channel.
Our Kubernetes version
We dynamically source our Kubernetes versions, via a datasource with version prefix filtering.
The below is responsible for fetching versions that match the provided prefix.
data"google_container_engine_versions""region_versions" {
provider=google-betalocation = var.gcp_region # Region definition as versions can vary between regions
version_prefix = "${local.k8s_version}." # This is the version filter, at the time of writing this, it's 1.29.
}
Subsequently, we set the kubernetes_version like so:
The kubernetes_version field is then implicitly mapped to the min_master_version field, since as mentioned above you can’t
explicitly declare a Kubernetes version, you can only declare the minimum you want installed in a cluster.
Control Plane Upgrades
When a control plane update takes place, during a maintenance window or through a manual update, some downtime could be expected,
depending on the Location type of your cluster.
Zonal
The Zonal Kubernetes clusters only have one master node backing them, and when an upgrade is taking place, there could be
several minutes of master downtime. This means that kubectl stops working, and applications that require the Kubernetes API stop working.
You also can’t make any cluster changes while the upgrade is taking place. Deployments, services and various other Kubernetes constructs still work during this time.
Regional
Regional clusters provide multi-zone, highly available Kubernetes masters (3 Zones). These masters are behind a loadbalancer, and upgrades
are being done in such a way that there is no disruption during an upgrade. The masters are upgraded once at a time, in no specific
order, and each one of the masters is unavailable only during it’s upgrade duration.
Our Location Type
We utilize Regional clusters, meaning that downtime should be kept to the minimum while upgrading the control plane.
Node upgrades
When it comes to upgrading your nodes, there’s more than a single strategy. That being said, between the strategies, some steps remain common:
The node to be upgraded is cordoned so no new pods can be scheduled on it
The node to be upgraded is drained. All strategies respect the pod’s PDBs (Pod Disruption Budgets) and
GracefulTerminationPeriod setting (Up to an hour for SURGE, and configurable for BLUE-GREEN)
Depending on the strategy, node upgrades can take a few hours to finish.
Some factors that could affect the overall duration of the upgrade:
Attached Persistent Volumes (Detachment/Reattachment can take time)
The SURGE strategy
This strategy upgrades nodes in a rolling fashion. Nodes are drained of traffic, upgraded,
and brought back online while the remaining nodes continue handling traffic. Steps include:
Provision a new node
Wait for it to be ready
Cordon and drain the node to be replaced so no new pods are scheduled on it while existing workloads can finish running
Delete the node to be replaced
Keep in mind that resources need to be available for the new surge nodes to come up, otherwise GKE won’t start a node upgrade.
Primary Pros
Cost-effective
Simpler
Faster
Primary Cons
Potential Downtime (Apps running on the drained nodes)
No easy rollback (Requires manual downgrading of the affected nodes)
Main audience should be stateless applications (Where disruptions are more tolerated)
The BLUE-GREEN strategy
This strategy involves GKE creating a new set of node resources (the “green” nodes), with the new node configuration before
evicting any workloads on the original resources (the “blue” nodes). It’s important to note that GKE will keep the “blue” nodes until
all traffic have been shifted to the “green” nodes.
Primary Pros
Rollback mid upgrade if issues arise are possible
A safe space(green) for testing out the release
As close to 0 downtime as possible
Primary Cons
Significant cost
Complexity
Need to have much higher quota headroom than SURGE to work properly
Our node upgrade strategy
Both strategies have their use cases. In our case,
we use the SURGE strategy, with max_surge set to 1 and max_unavailable set to 0.
What this means is that only one surge node is added at a time, thus one node is being upgraded, at a time. Also, pods can restart immediately
on the new surge node.
A SURGE strategy with the max_surge and max_unavailable values we use, is typically the slowest of the bunch (still much quicker that blue-green),
but the least disruptive. By tweaking those 2 values you can balance speed and disruption potential.
Our node versions
We do not explicitly set any version for our nodes, but we have
auto_upgrade = true
in our node_pool configuration. What this means is that every time the Kubernetes control plane is upgraded,
a node upgrade is scheduled automatically for the next maintenance window, to match that version. Naturally, the node and control plane
versions won’t be the same at all times, but it’s fine as long as we adhere to the Kubernetes version skew policy.
Identity Provider Login for Internal Services
Internal services such as:
Grafana
Platform Docs
Are exposed with Identity Provider login, currently only Google Gsuite is supported.
The domain must be different from your ingress_domains.
DNS delegation for that domain should be configured as in DNS
Alert runbooks
Alerts runbooks
This contains a collection of runbooks that need to be followed for each alert raised on the platform.
Each alert should contain a short description and a deep link to the corresponding alert in this document.
KubePodCannotConnectToInternet
Is this affecting pods network and node network too?
Review and update cluster-wide minimal resource limits set for cluster auto-scaler.
KubeHpaReplicasMismatch
Horizontal Pod Autoscaler has not matched the desired number of replicas for longer than 15 minutes.
HPA was unable to schedule desired number of pods.
Check why HPA was unable to scale:
not enough nodes in the cluster
hitting resource quotas in the cluster
pods evicted due to pod priority
In case of cluster-autoscaler you may need to set up preemptive pod pools to ensure nodes are created on time.
KubeHpaMaxedOut
Horizontal Pod Autoscaler (HPA) has been running at max replicas for longer than 15 minutes.
HPA won’t be able to add new pods and thus scale application.
Notice: for some services maximizing HPA is in fact desired.
Check why HPA was unable to scale:
max replicas too low
too low value for requests such as CPU?
If using basic metrics like CPU/Memory then ensure to set proper values for requests.
For memory based scaling ensure there are no memory leaks.
If using custom metrics then fine tune how app scales accordingly to it.
Use performance tests to see how the app scales.
ContainerInErrorState
Container is not starting up, stuck in waiting state.
Identify which pod is causing the issue
in grafana:
What is preventing pod to start? Is the container in CrashLoopBackOff? Check pod events:
kubectl -n <pod_namespace> describe pod <pod_name>
If in CrashLoopBackOff state, check the process within the container is correctly configured. More info
on debugging can be
found in GKE docs
Is the image being pulled correctly? Check namespace events:
kubectl -n <pod_namespace> get events --sort-by=.lastTimestamp
If in ErrImagePull or ImagePullBackOff check if the container name is configured correctly and the tag exists in the
registry. More info on debugging can be
found in GKE docs
Can the pod be scheduled? Check request/limits on the container and ensure there is enough in the cluster. More info
on debugging can be found
in GKE docs
NatGatewayHighPortUtilisation
Meaning
High port utilisation by NAT Gateway, port allocation reached 70%. Each external IP address provides 64,512 available
ports that are shared by all VMs. Each port corresponds to a connection to unique destination address (IP:PORT:
PROTOCOL). When NAT Gateway runs out of free ports, it will start dropping outbound packets (requests going out to
the internet).
Impact
No outbound requests are affected at this point; however, you’re getting closer to the limit. Once utilisation is closer
to 100%, some outbound requests will be affected.
Warning
Utilisation doesn’t have to reach 100% for requests to be affected. NAT Gateway will try to allocate at least the number
of ports specified in network.publicNatGateway.minPortsPerVm configuration. If there are not enough ports available to
satisfy this value, no ports will be allocated to VM in need.
Failure in allocating NAT IPs to any VM in the NAT gateway. In result, services residing on affected VM’s will not be
able to reach the internet. NAT Gateway allocates single IP to multiple VM’s. When there are not enough available NAT
source IP addresses and source port tuples (IP:PORT:PROTOCOL), the NAT Gateway won’t be able to service any new outbound
connections.
One of the application components is not healthy, resulting in the whole application being marked as unhealthy.
Impact
Tenant resources are allocated as the ArgoCD applications,
meaning that part of the tenant functionality might not be working as expected.
For example, some of the tenant permissions might be missing.
Diagnosis & Mitigation
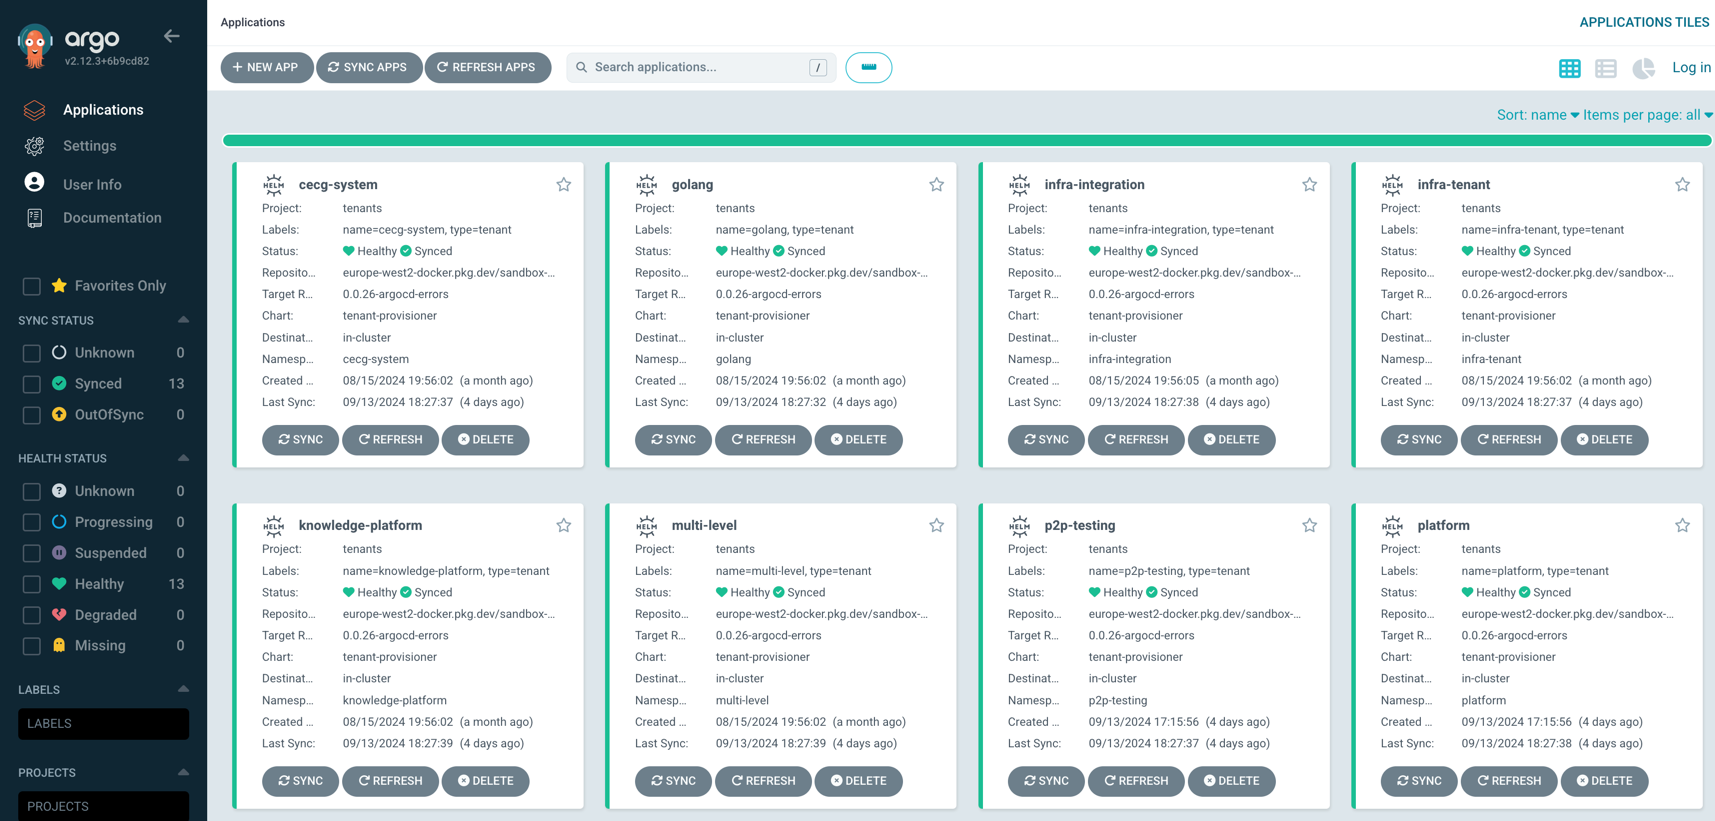
Identify the problematic component by checking the ArgoCD UI: https://argocd.{{ internalServices.domain }}
Act accordingly to the error:
If the error is related to environment configuration, fix the configuration.
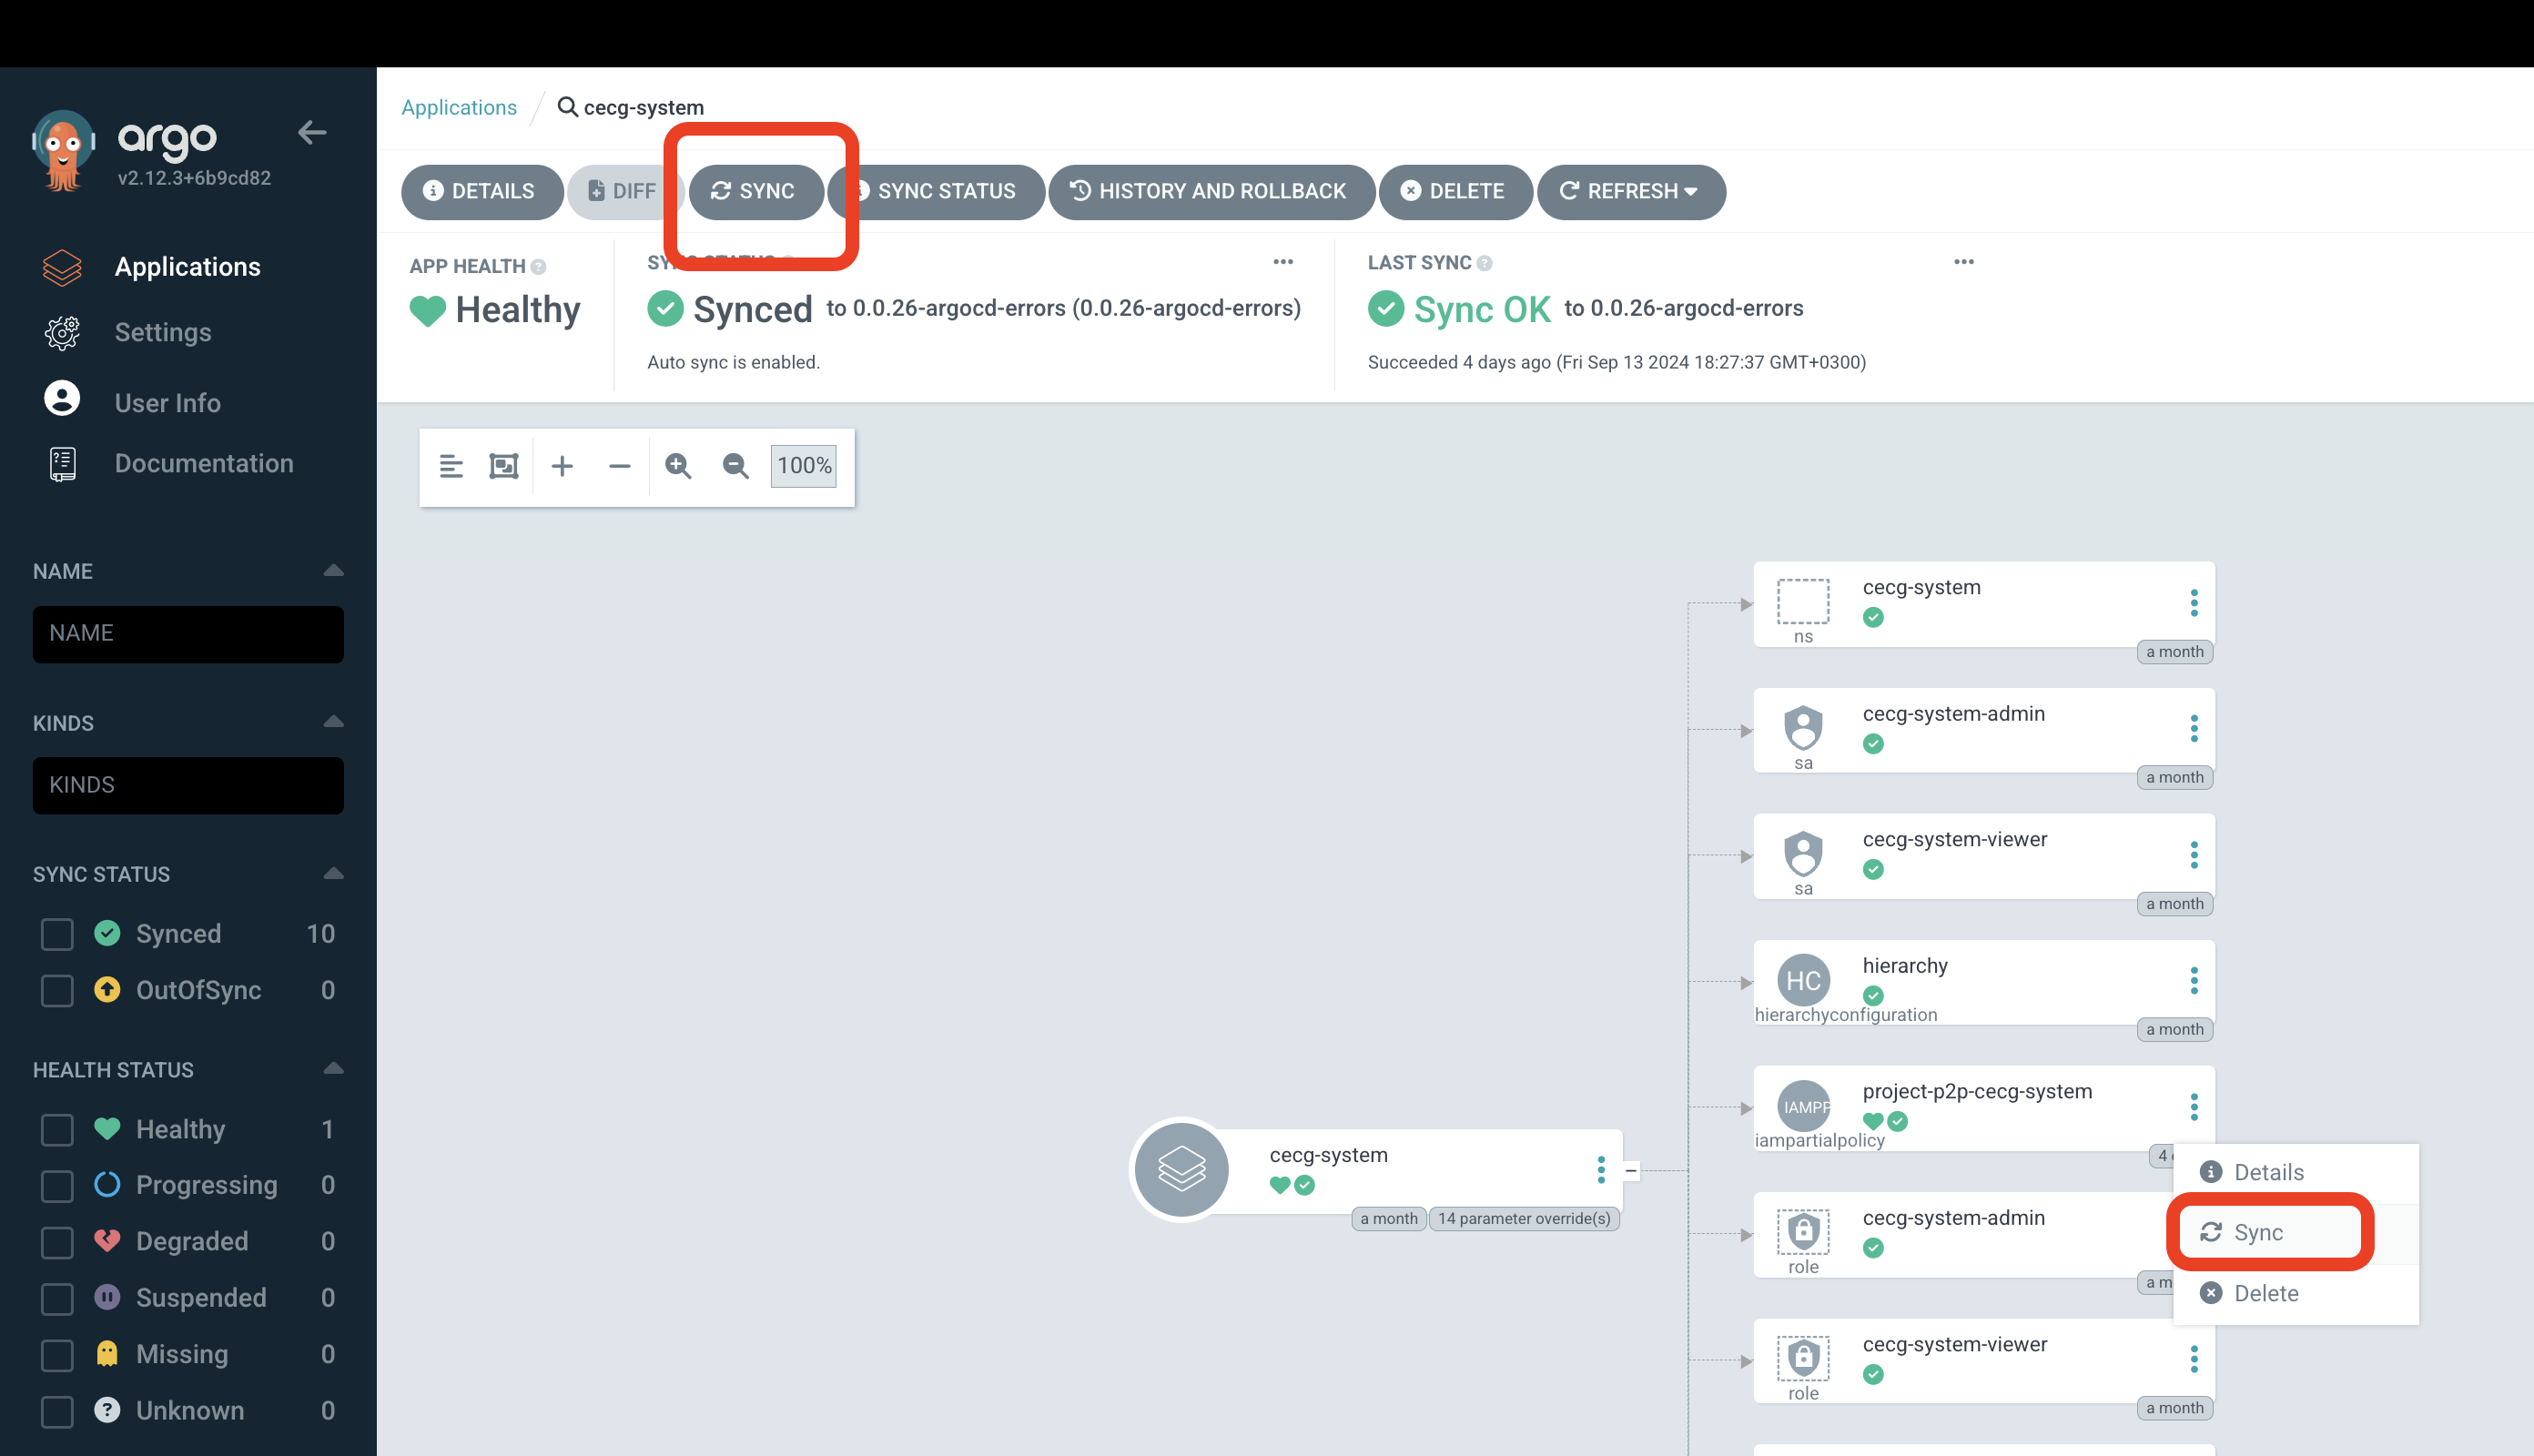
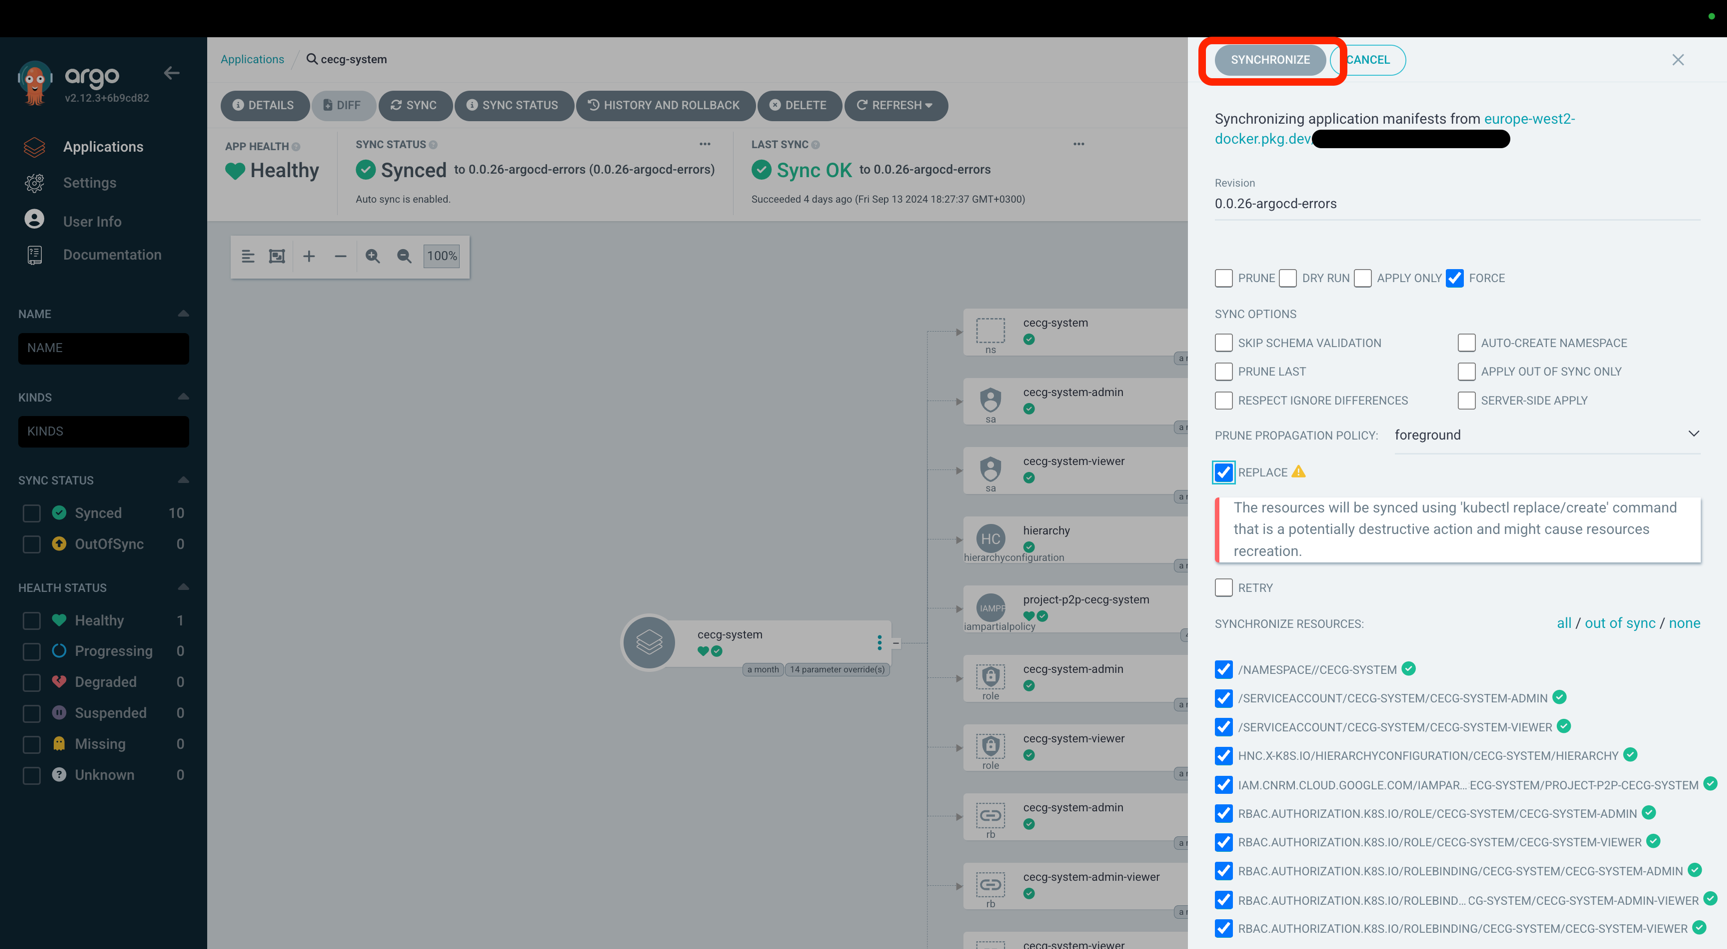
If the errors can be fixed by re-applying the manifests,
you can do so by running Sync operation for the resource with Replace and Force options.
Here is the How-to on how to do it.
If it doesn’t help, contact the Core Platform team.
ArgoCDApplicationIsNotSynced
Meaning
Application components state is different from the desired state.
Impact
Tenant resources are allocated as the ArgoCD applications,
meaning that part of the tenant functionality might not be working as expected.
For example, some of the tenant permissions might be missing.
Diagnosis & Mitigation
Identify the problematic component by checking the ArgoCD UI: https://argocd.{{ internalServices.domain }}
If the resource can’t be updated because it’s immutable,
it’s most probably a bug and should be fixed by Core Platform team.
But you can try to do a quick fix by syncing it with Replace and Force options via ArgoCD UI.
Here is the How-to on how to do it.
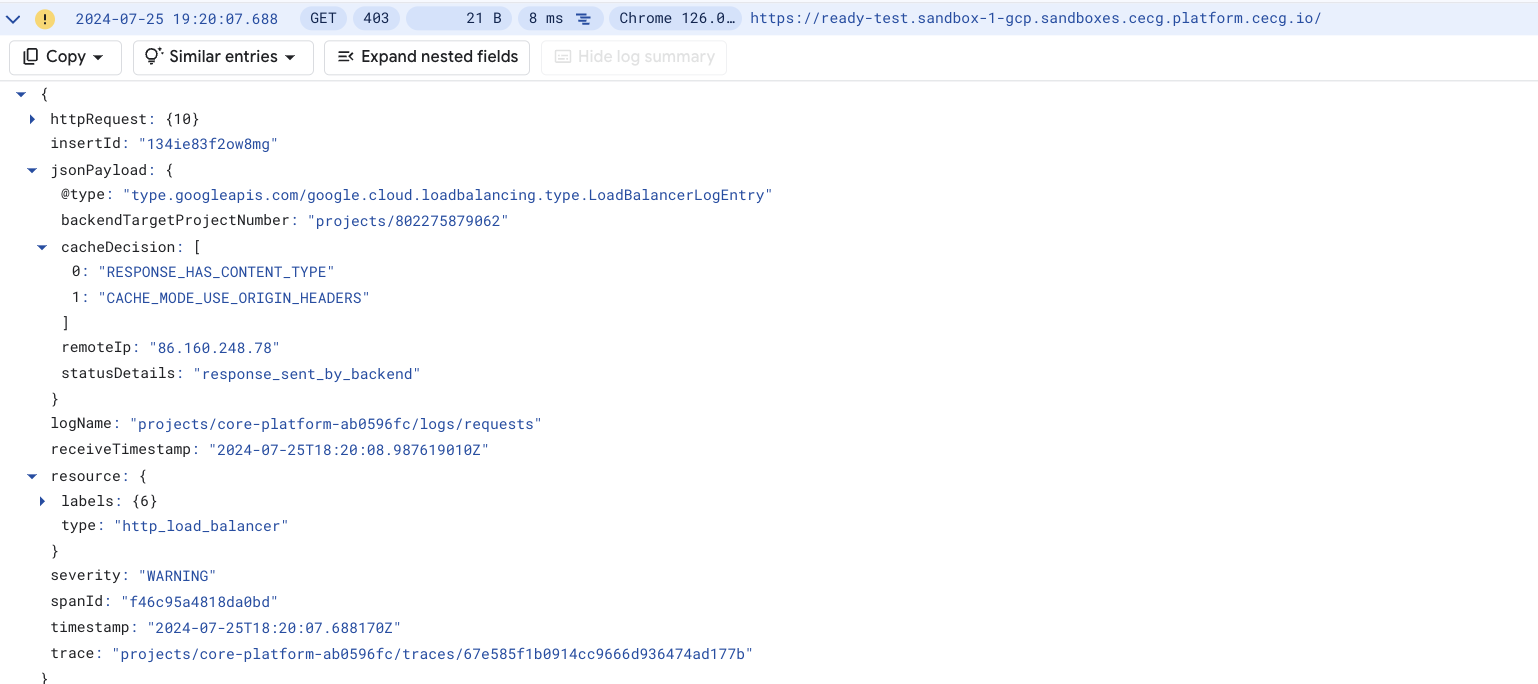
NoIapAuthOnInternalServiceDomain
Meaning
Some or all services on the platform’s designated internal services domain can be accessed without authentication. For
more information on platform’s authenticated endpoints see Platform ingress and
Internal services page. This alert is triggered by accessing podinfo svc
on https://ready.{{ internalServices.domain }} as unauthenticated user and receiving 200 response code
(expected 302 redirect to google auth)
Impact
Potentially, we’re exposing internal endpoints on public network that can be accessed by anyone. This is major
incident and should be dealt with immediately.
Diagnosis & Mitigation
Validate that you can access internal endpoint without authentication:
You’ll get statusCode 200 if you can, otherwise 301 redirect to google auth endpoint.
Go to IAP configuration in GCP console and select a project.
You’ll see two backend services (one for each k8s traefik svc), ensure the backend service with name containing
platform-ingress-traefik-iap has IAP enabled. The other should have IAP disabled.
Ensure there is no errors in Status column on both backend services. In case of errors, re-enabled IAP on affected
backend service and re-test.
Validate environment Gateway configuration
kubectl get httproute -n platform-ingress
Check that HOSTNAMES are correctly configured, where {{ ingressDomains.domain }} should point to IAP disabled
backend service (traefik), and {{ internalServices.domain }} should point to IAP enabled one (traefik-iap)
kubectl get gateway -n platform-ingress -o yaml
Check that allowedRoutes are correctly configured according to httpRoutes
Platform Implementation
Platform Implementation describes how things work rather than how to use them.
This section of the docs is for Platform Engineers wanting to contribute or understand how things work under the covers.
Subsections of Platform Implementation
Alerting
Alerting
Alert manager
Managed alertmanager is a single replica statefulset deployed with Google Managed Prometheus.
It receives alerts from the rule evaluator and sends notification to configured receivers.
kubectl -n gmp-system get sts alertmanager
kubectl -n gmp-system get deploy rule-evaluator
kubectl -n platform-monitoring get deploy grafana-operator
kubectl -n platform-monitoring get deploy platform-grafana-deployment
Dashboards
Dashboards are automatically synced by the operator.
You can use the grafanadashboard resources to check its status and when it was last synced.
kubectl -n platform-monitoring get grafanadashboard
NAME                    NO MATCHING INSTANCES   LAST RESYNC   AGE
bastion                                         42m           7h43m
continuous-load                                 2m17s         7h43m
kubernetes-apiserver                            42m           7h43m
[...]
When exporting dashboard json from Grafana, make sure special characters are replaced as follows
Prometheus: points to the prometheus frontend to access all dashboard metrics
Alertmanager: points to the managed alertmanager to manage silences, view firing alerts, contact points, and notification policies
Infra Connector
Infra Connector
Infra connector is a module in the reference core platform that allows to create cloud objects using kubernetes resources.
Current implementation for GCP uses the k8s config connector
Installing these will make available a variety of CRD that will allows to create different GCP resources without the need to write terraform code. For example:
apiVersion: iam.cnrm.cloud.google.com/v1beta1kind: IAMServiceAccountmetadata:
name: {{include "account.fullname" .Values.tenant.name }}annotations:
propagate.hnc.x-k8s.io/none: "true"spec:
displayName: GCP Service Account for tenant {{ .Values.tenant.name }}
This will create a GCP SA for each the tenant being provisioned
Current usage
The goal of this modules is to decouple terraform from the platform modules. Having this allows us to create cloud resources with something like helm and doesn’t tie us down to terraform. Meaning we can couple or decouple any other modules a lot easier.
This means that this is 1 of the 2 modules in the current implementation that uses terraform, everything else is installed with the help of a script. If they require cloud resources, they will create them using the infra connector CRDs.
Future usage
Another advantage of using this is that we can allow tenants to create GCP resources like buckets, databases etc that they might need without needing to reaching out to the platform or to a DevOps team, making the more independent. What they can and can’t create will be control with a mix of RBAC and policy controller - A Role that will specify which objects they can create, and the policy controller to ensure what they create is allowed and it won’t impact any other tenant.
Generates metrics from a wide range of Kubernetes objects.
These can be used to assess the health of your pods, deployment, jobs and many other Kubernetes objects.
They generally start with kube_.
It runs as a deployment:
kubectl -n gmp-public get deploy kube-state-metrics
Note that GMP re-labels namespace to exported_namespace as it reserves namespace for the namespace of the pod that
the metric is scraped from. When importing dashboards that rely on kube-state-metrics metrics, the queries must use exported_namespace.
Collects metrics for containers running on the node ; it runs alongside kubelet on each node.
Typical metrics include cpu, memory, I/O usage which can be used to diagnose performance issues.
kubelet is the agent running on the node that is responsible to ensure containers are running and healthy.
Collected metrics can be used to identify pod start duration, the number of pods and containers on the node
and other information about the node, such as status
This is used to probe key endpoints on or outside the platform, so we can monitor uptime and SSL expiry of components with TLS termination.
It runs as a deployment:
kubectl -n platform-monitoring get deploy prometheus-blackbox-exporter
0/7 nodes are available: 7 Insufficient memory. preemption: 0/7 nodes are available: 1 Insufficient memory, 6 No preemption victims found for incoming pod.
Pods are stuck in Pending state.
Total memory requests for pods have exceeded the maximum memory that is allowed as part of node autoscaling in the
cluster.
Resolution
Update config.yaml to increase the memory limit of the cluster autoscaling. Example:
There are times where a node can be throttled e.g. 96% memory usage when other nodes have more than enough capacity to
accommodate extra workloads.
It is highly likely that pods running on that node do not have memory/cpu requests set. This causes kube scheduler to
place significant load on one node as it uses the requests to target what nodes pods should be placed on.
Resolution
Set resource requests for your application workloads to allow the kube scheduler better place
your pods on nodes with appropriate capacity. For example if you request 2Gi memory for your pod, the scheduler will
guarantee finding a node that has that capacity.
Deployment Failures
Local port [xxxx] is not available
A local port is used locally on the GitHub agent to IAP proxy to the Kubernetes API server.
Sometimes a randomly selected port is not available.
Logs
2023-11-17T16:31:21.6142491Z --- Start tunnel (IAP)
2023-11-17T16:31:28.1159411Z ERROR: (gcloud.compute.start-iap-tunnel) Local port [57834] is not available.
Actions
The job can be re-run using re-run failed jobs
Ingress / TLS Failures
A new ingress domain is not working
When adding a new ingress domain the platform:
Creates a Cloud DNS Managed Zone. You need to set up delegation for this domain so that Cloud DNS becomes the Name
server.
IPs not being allowlisted by traefik
You have configured to allowlist IPs using traefik middlewares but are still getting forbidden when accessing endpoints
from a valid IP address.
Cert manager at times does not find the new Cloud DNS Zone. If this is the case you’ll see cert manager logs like:
E1124 04:28:57.742110 1 controller.go:167] "cert-manager/challenges: re-queuing item due to error processing" err="No matching GoogleCloud domain found for domain XXXX.XX." key="platform-ingress/ingress-tls-secure-1-2070261079-2597927957"
On restarting the error should go away. If not, raise a support ticket with the logs for:
External-DNS
Cert Manager
Output from:
kubectl get pods -n platform-ingress
kubectl get certificates -n platform-ingress
kubectl get certificaterequests -n platform-ingress
kubectl describe gateway traefik -n platform-ingress
NAT Gateway IP Allocation Failures
Are there not enough IPs allocated? Validate the root cause:
Single service is keeping a lot of connections open
Go to
Grafana platform-monitoring/NAT Gateway dashboard and check:
which VM’s have unusual high open connections,
which VM’s have unusual high number of allocated ports
correlate this information
with Network Received by Namespace graph
in platform-monitoring/Kubernetes/Views/Global dashboard on Grafana. To find namespace that uses most
network bandwidth, then check which pod belongs to that namespace in Network Bandwidth graph in
platform-monitoring/Kubernetes/Views/Pods.
[Optional] Enable NAT Gateway logging if not already enabled. Logging provides more detailed information on
existing connections. To enable logs update network.publicNatGateway.logging value to one of ERRORS_ONLY,
TRANSLATIONS_ONLY, ALL:
network:
  publicNatGateway:
    logging: TRANSLATIONS_ONLY - update to desired logging level
Cluster Autoscaller is creating an excessive number of VMs. Validate in GCP dashboard, node-pools, metrics
The Cluster grew naturally and more source NAT IPs are required. If above are not causing the issue, validate
that there is a valid reason for more IPs to be reserved and attached to the NAT Gateway. Look at long-term
trends of services, node, port allocation growth.
Warning
Allocating more IP addresses might cause source IP changes to existing services for outbound requests. If third party
clients allowlisted specific IPs, they’ll need to update their allowlist accordingly.
Increase the number of IPs allocated to NAT Gateway. Update number of IPs in your
environments/<env_name>/config.yaml file:
network:
  publicNatGateway:
    ipCount: <number of IP's allocated> - increase this value to desired number of IP's
Release the change and validate that port utilisation went down below 70%.
Do you allocate too many min ports per VM?
Go to Grafana platform-monitoring/NAT Gateway dashboard and validate allocated ports per VM against used ports
per VM. Ensure to extend time span to take into account all traffic spikes. If most of the time ports are being
allocated but not used you can decrease the minPortsPerVm setting in environments/<env_name>/config.yaml
file:
network:
  publicNatGateway:
    minPortsPerVm: <min number of ports allocated to single VM> - decrease this value to release ports
If all ports are utilised, check if you
can Reduce your port usage otherwise increase
the ipCount value (section 1)
Warning
Increasing the number of IPs is a safe operation; the existing connections won’t be affected, however, decreasing the
value without draining the connections first will cause connection being terminated immediately.
See Impact of tuning NAT configurations on existing NAT connections
for further details.
NAT Gateway provisioning/updates failures
Error: Error when reading or editing Address: googleapi: Error 400: External address used for NAT cannot be deleted., badRequest
During updates to your network.publicNatGateway.ipCount configuration when you try to remove already allocated IP address the
update will fail. To decrease the number of allocated IPs, please drain it first then remove it from NAT Gateway
manually before running IAC tool.
Follow Decrease allocated number of IP addresses.
NAT Gateway high error count in logs
NAT Gateway will only log errors related to packet drops because no port was available for NAT. To investigate and
resolve, follow below:
Increase the log level to ALL (if not already on this level) to get more details about successful connections (see
if any of errored connections are successful)
If high errors count on packets send, check the trend of packet drops per reason in platform-monitoring/NAT Gateway
Grafana dashboard, for
OUT_OF_RESOURCES reason
follow Packets dropped with reason: out of resources
Note
We use manual NAT IP address assignment with dynamic port allocation
NAT Gateway high number of received packet drops
Note
A Cloud NAT gateway drops an ingress data packet if the connection tracking table doesn’t contain any entry for the
connection. Those can be due to timeouts or external endpoint trying to establish a connection. Higher number than usual
might not indicate any degradation of any services.
Check long window trend of received packet drop rate in platform-monitoring/NAT Gateway Grafana dashboard.
Establish which VM/pod is experiencing the highest drops, then validate it is a genuine failure.
For genuine failures,
see Dropped received packets for hints on how
to resolve.
Spot instances are not recommended for running workloads that are not fault tolerant.
Note
Spot works well if you need to cut down costs for your clusters. See minimising costs.
Cluster setup with minimal costs
Create a cluster with Spot instances, HDD disk and e2-medium disk type.
cluster:
gcp:
additionalNodePools:
- name: "spot-pool"machineType: "e2-medium"diskType: "pd-standard"minCount: 0maxCount: 5spot: true# Nodepool with 5 VMs using standard will cost $162 per month# Nodepool with 5 VMs using spot nodes will cost $61 per month
Exclude Logs
Log exclusions
To change log retention or set up exclusion filters configure in your config.yaml:
platformLogging:
logRetentionDays: 10exclusionFilters:
- name: my-exclusiondescription: Excludes info messages from my-containerfilter: resource.labels.container_name = my-container AND severity = Info
Alerts on key metrics can be useful to reduce your time to detection of issues. See Platform Monitoring for what type of dashboards and metrics are available on the platform.
Alert notifications
To send alerts to a dedicated slack channel, configure a slack webhook in your config.yaml: