Platform Troubleshooting
Autoscaling failures
0/7 nodes are available: 7 Insufficient memory
0/7 nodes are available: 7 Insufficient memory. preemption: 0/7 nodes are available: 1 Insufficient memory, 6 No preemption victims found for incoming pod.Pods are stuck in Pending state.
Total memory requests for pods have exceeded the maximum memory that is allowed as part of node autoscaling in the cluster.
Resolution
Update config.yaml to increase the memory limit of the cluster autoscaling. Example:
cluster:
  gcp:
    autoscaling:
      cpuCores: 30
      memoryGb: 140
After the limits have been applied to the cluster, the pod should transition from Pending to Running state.
0/7 nodes are available: 7 Insufficient cpu
0/7 nodes are available: 7 Insufficient cpu. preemption: 0/7 nodes are available: 1 Insufficient cpu, 6 No preemption victims found for incoming pod.Pods are stuck in Pending state.
Total cpu requests for pods have exceeded the maximum cpu that is allowed for node autoscaling.
Resolution
Update config.yaml to increase the cpu limit of the cluster autoscaling. Example:
cluster:
  gcp:
    autoscaling:
      cpuCores: 60
      memoryGb: 140
Node Imbalance
There are times where a node can be throttled e.g. 96% memory usage when other nodes have more than enough capacity to accommodate extra workloads.
It is highly likely that pods running on that node do not have memory/cpu requests set. This causes kube scheduler to place significant load on one node as it uses the requests to target what nodes pods should be placed on.
Resolution
Set resource requests for your application workloads to allow the kube scheduler better place your pods on nodes with appropriate capacity. For example if you request 2Gi memory for your pod, the scheduler will guarantee finding a node that has that capacity.
Deployment Failures
Local port [xxxx] is not available
A local port is used locally on the GitHub agent to IAP proxy to the Kubernetes API server. Sometimes a randomly selected port is not available.
Logs
2023-11-17T16:31:21.6142491Z --- Start tunnel (IAP)
2023-11-17T16:31:28.1159411Z ERROR: (gcloud.compute.start-iap-tunnel) Local port [57834] is not available.
Actions
The job can be re-run using re-run failed jobs
Ingress / TLS Failures
A new ingress domain is not working
When adding a new ingress domain the platform:
- Creates a Cloud DNS Managed Zone. You need to set up delegation for this domain so that Cloud DNS becomes the Name server.
IPs not being allowlisted by traefik
You have configured to allowlist IPs using traefik middlewares but are still getting forbidden when accessing endpoints from a valid IP address.
Enable JSON logs
Edit traefik deployment to add the arguments:
kind: Deployment
metadata:
  name: traefik
  namespace: platform-ingress
...
spec:
    containers:
    - args:
      - --log.level=DEBUG
      - --log.format=json
      - --accesslog=true
      - --accesslog.format=json
View traefik logs
kubectl logs -f deployment/traefik -n platform-ingress

Logs:

  { "level": "debug","middlewareName": "platform-ingress-ready-ipwhitelist@kubernetescrd","middlewareType": "IPWhiteLister","msg": "Accepting IP 86.160.248.78","time": "2024-08-07T22:03:23Z" }
Check Load Balancer logs
On the Google Console navigate to Logging Explorer navigate and run the following query
resource.type="http_load_balancer" resource.labels.project_id="<your-gcp-project-id>"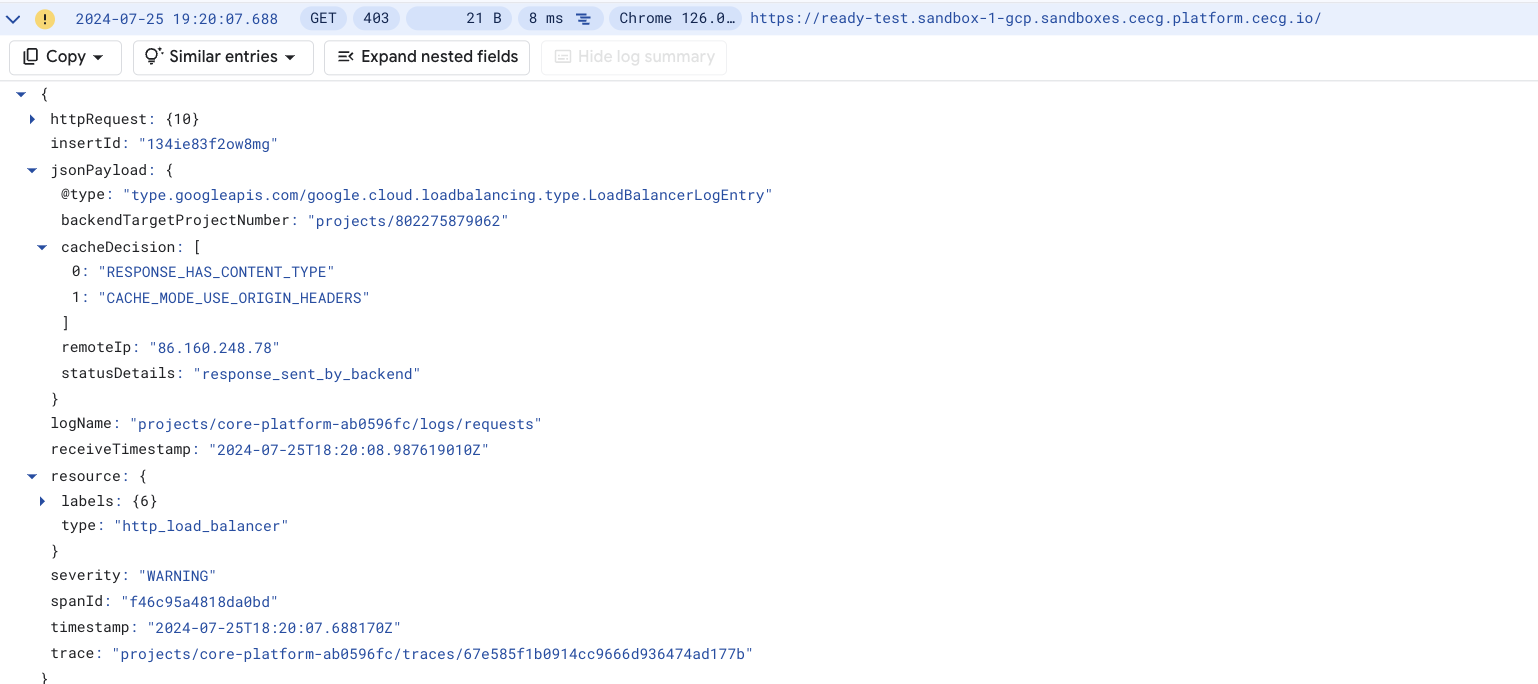
Load Balancer Logs
Actions
1. Setup DNS Zone delegation for the new domain
2. Restart cert manager
Cert manager at times does not find the new Cloud DNS Zone. If this is the case you’ll see cert manager logs like:
E1124 04:28:57.742110 1 controller.go:167] "cert-manager/challenges: re-queuing item due to error processing" err="No matching GoogleCloud domain found for domain XXXX.XX." key="platform-ingress/ingress-tls-secure-1-2070261079-2597927957"Restarting cert manager:
kubectl delete pods -n platform-ingress -l app=cert-managerOn restarting the error should go away. If not, raise a support ticket with the logs for:
- External-DNS
- Cert Manager
- Output from:
kubectl get pods -n platform-ingress
kubectl get certificates -n platform-ingress
kubectl get certificaterequests -n platform-ingress
kubectl describe gateway traefik -n platform-ingress
NAT Gateway IP Allocation Failures
-
Are there not enough IPs allocated? Validate the root cause:
- Single service is keeping a lot of connections open
-
Go to Grafana
platform-monitoring/NAT Gatewaydashboard and check:- which VM’s have unusual high open connections,
- which VM’s have unusual high number of allocated ports
- correlate this information
with
Network Received by Namespacegraph inplatform-monitoring/Kubernetes/Views/Globaldashboard on Grafana. To find namespace that uses most network bandwidth, then check which pod belongs to that namespace inNetwork Bandwidthgraph inplatform-monitoring/Kubernetes/Views/Pods.
-
[Optional] Enable NAT Gateway logging if not already enabled. Logging provides more detailed information on existing connections. To enable logs update
network.publicNatGateway.loggingvalue to one ofERRORS_ONLY,TRANSLATIONS_ONLY,ALL:network: publicNatGateway: logging: TRANSLATIONS_ONLY - update to desired logging levelSee Configure logging for log level explanation.
-
- Cluster Autoscaller is creating an excessive number of VMs. Validate in GCP dashboard, node-pools, metrics
- The Cluster grew naturally and more source NAT IPs are required. If above are not causing the issue, validate that there is a valid reason for more IPs to be reserved and attached to the NAT Gateway. Look at long-term trends of services, node, port allocation growth.
WarningAllocating more IP addresses might cause source IP changes to existing services for outbound requests. If third party clients allowlisted specific IPs, they’ll need to update their allowlist accordingly.
Increase the number of IPs allocated to NAT Gateway. Update number of IPs in your
environments/<env_name>/config.yamlfile:network: publicNatGateway: ipCount: <number of IP's allocated> - increase this value to desired number of IP'sRelease the change and validate that port utilisation went down below 70%.
- Single service is keeping a lot of connections open
-
Do you allocate too many min ports per VM?
-
Go to Grafana
platform-monitoring/NAT Gatewaydashboard and validate allocated ports per VM against used ports per VM. Ensure to extend time span to take into account all traffic spikes. If most of the time ports are being allocated but not used you can decrease theminPortsPerVmsetting inenvironments/<env_name>/config.yamlfile:network: publicNatGateway: minPortsPerVm: <min number of ports allocated to single VM> - decrease this value to release portsSee Choose a minimum number of ports per VM for further details.
-
If all ports are utilised, check if you can Reduce your port usage otherwise increase the
ipCountvalue (section 1)
-
Increasing the number of IPs is a safe operation; the existing connections won’t be affected, however, decreasing the value without draining the connections first will cause connection being terminated immediately. See Impact of tuning NAT configurations on existing NAT connections for further details.
NAT Gateway provisioning/updates failures
Error: Error when reading or editing Address: googleapi: Error 400: External address used for NAT cannot be deleted., badRequestDuring updates to your network.publicNatGateway.ipCount configuration when you try to remove already allocated IP address the
update will fail. To decrease the number of allocated IPs, please drain it first then remove it from NAT Gateway
manually before running IAC tool.
Follow Decrease allocated number of IP addresses.
NAT Gateway high error count in logs
NAT Gateway will only log errors related to packet drops because no port was available for NAT. To investigate and resolve, follow below:
- Increase the log level to
ALL(if not already on this level) to get more details about successful connections (see if any of errored connections are successful) - If high errors count on packets send, check the trend of packet drops per reason in
platform-monitoring/NAT GatewayGrafana dashboard, forOUT_OF_RESOURCESreason follow Packets dropped with reason: out of resourcesNoteWe use manual NAT IP address assignment with dynamic port allocation
NAT Gateway high number of received packet drops
A Cloud NAT gateway drops an ingress data packet if the connection tracking table doesn’t contain any entry for the connection. Those can be due to timeouts or external endpoint trying to establish a connection. Higher number than usual might not indicate any degradation of any services.
- Check long window trend of received packet drop rate in
platform-monitoring/NAT GatewayGrafana dashboard. Establish which VM/pod is experiencing the highest drops, then validate it is a genuine failure. For genuine failures, see Dropped received packets for hints on how to resolve.